Unity Catalog Governance in Action: Monitoring, Reporting, and Lineage
by Ari Kaplan and Pearl Ubaru
Databricks Unity Catalog ("UC") provides a single unified governance solution for all of a company's data and AI assets across clouds and data platforms. This blog digs deeper into the prior Unity Catalog Governance Value Levers blog to show how the technology itself specifically enables positive business outcomes through comprehensive data and AI monitoring, reporting, and lineage.
Overall challenges with traditional non-unified governance
The Unity Catalog Governance Value Levers blog discussed the "why" of the organizational importance of governance for information security, access control, usage monitoring, enacting guardrails, and obtaining "single source of truth" insights from their data assets. These challenges compound as their company grows and without Databricks UC, traditional governance solutions no longer adequately meet their needs.
The major challenges discussed included weaker compliance and fractured data privacy controlled across multiple vendors; uncontrolled and siloed data and AI swamps; exponentially rising costs; loss of opportunities, revenue, and collaboration.
How Databricks Unity Catalog Supports a Unified View, Monitoring, and Observability
So, how does this all work from a technical standpoint? UC manages all registered assets across the Databricks Data Intelligence Platform. These assets can be anything within BI, DW, data engineering, data streaming, data science, and ML. This governance model provides access controls, lineage, discovery, monitoring, auditing, and sharing. It also provides metadata management of files, tables, ML models, notebooks, and dashboards. UC gives one single view of your entire end-to-end information, through the Databricks asset catalog, feature store and model registry, lineage capabilities, and metadata tagging for data classifications, as discussed below:
Unified view of the entire data estate
Asset catalog: through system tables that contain metadata, you can see all that is contained in your catalog such as schemas, tables, columns, files, models, and more. If you are not familiar with volumes within Databricks, they are used for managing non-tabular datasets. Technically, they are logical volumes of storage to access files in any format: structured, semi-structured, and unstructured.
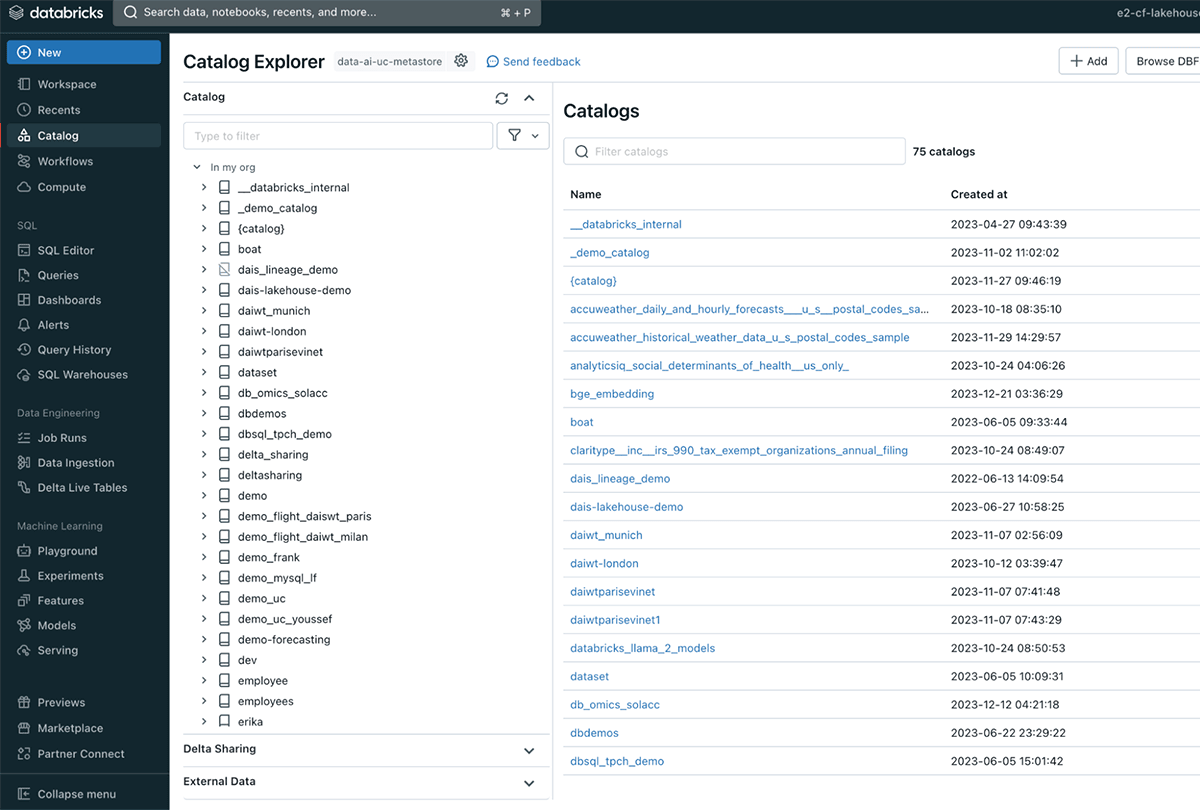
Catalog Explorer lets you discover and govern all your data and ML models - Feature Store and Model Registry: define features used by data scientists within the centralized repository. This is helpful for consistent model training and inference for your entire AI workflow.
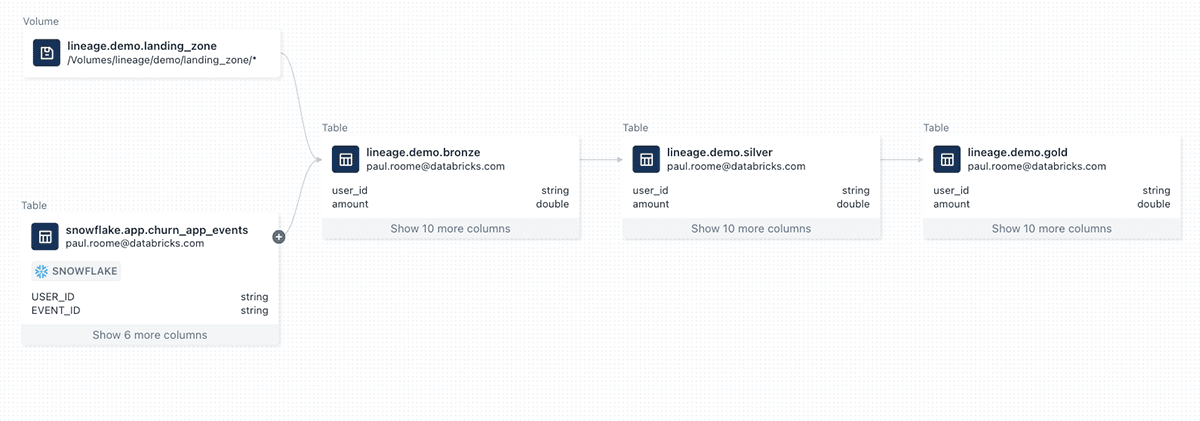
- Lineage capabilities: trust in your data is key for your business to take action in real life. End-to-end transparency into your data is needed for trust in your reports, models, and insights. UC makes this easy through lineage capabilities, providing insights on: What are the raw data sources? Who created it and when? How was data merged and transformed? What is the traceability from the models back to the datasets they are trained on? Lineage shows end-to-end from data to model - both table-level and column-level. You can even query across data sources such as Snowflake and benefit immediately:
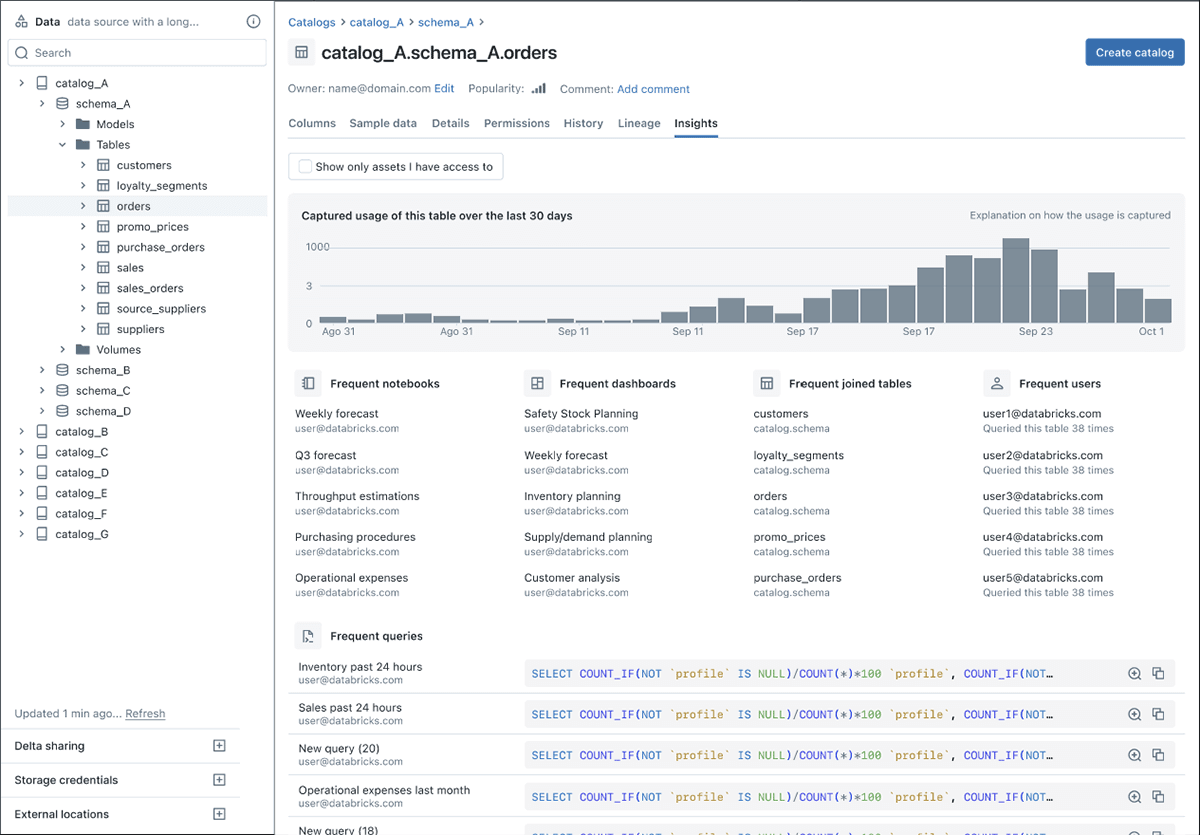
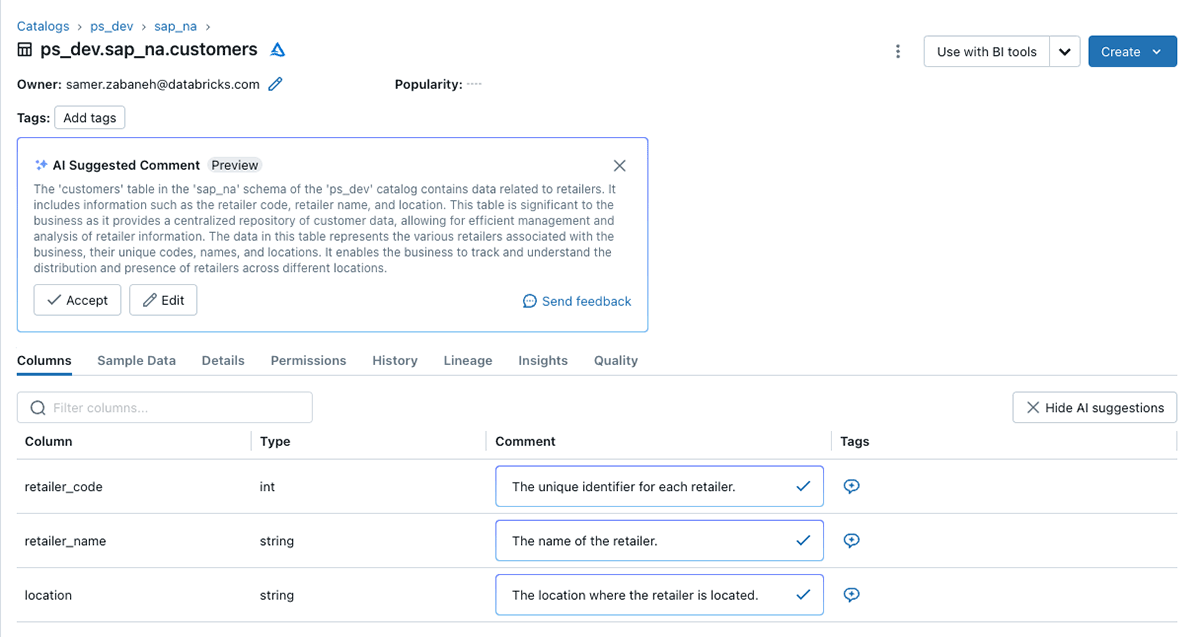
- Metadata tagging for data classifications: enrich your data and queries by providing contextual insights about your data assets. These descriptions at the column and table level can be manually entered, or automatically described with GenAI by Databricks Assistant. Below is an example of descriptions and quantifiable characteristics:
Having one unified view results in:
- Accelerated innovation: your insights are only as good as your data. Your analysis is only as good as the data you access. So, streamlining your data search drives faster and better generation of business insights, driving innovation.
- Cost reduction through centralized asset cataloging: lowers license costs (just one vendor solution versus needing many vendors), lowers usage fees, reduces time to market pains, and enables overall operational efficiencies.
- It's easier to discover and access all data by reducing data sprawl across several databases, data warehouses, object storage systems, and more.
Comprehensive data and AI monitoring and reporting
Databricks Data Quality Monitoring allows teams to monitor their entire data pipelines — from data and features to ML models — without additional tools and complexity. Powered by Unity Catalog, it lets users uniquely ensure that their data and AI assets are high quality, accurate and reliable through deep insight into the lineage of their data and AI assets. The single, unified approach to monitoring enabled by lakehouse architecture makes it simple to diagnose errors, perform root cause analysis, and find solutions.
How do you ensure trust in your data, ML models, and AI across your entire data pipeline in a single view regardless of where the data resides? Databricks Data Quality Monitoring is the industry's only comprehensive solution from data (regardless of where it resides) to insights. It accelerates the discovery of issues, helps determine root causes, and ultimately assists in recommending solutions.
UC provides Lakehouse Monitoring capabilities with both democratized dashboards and granular governance information that can be directly queried through system tables. The democratization of governance extends operational oversight and compliance to non-technical people, allowing a broad variety of teams to monitor all of their pipelines.
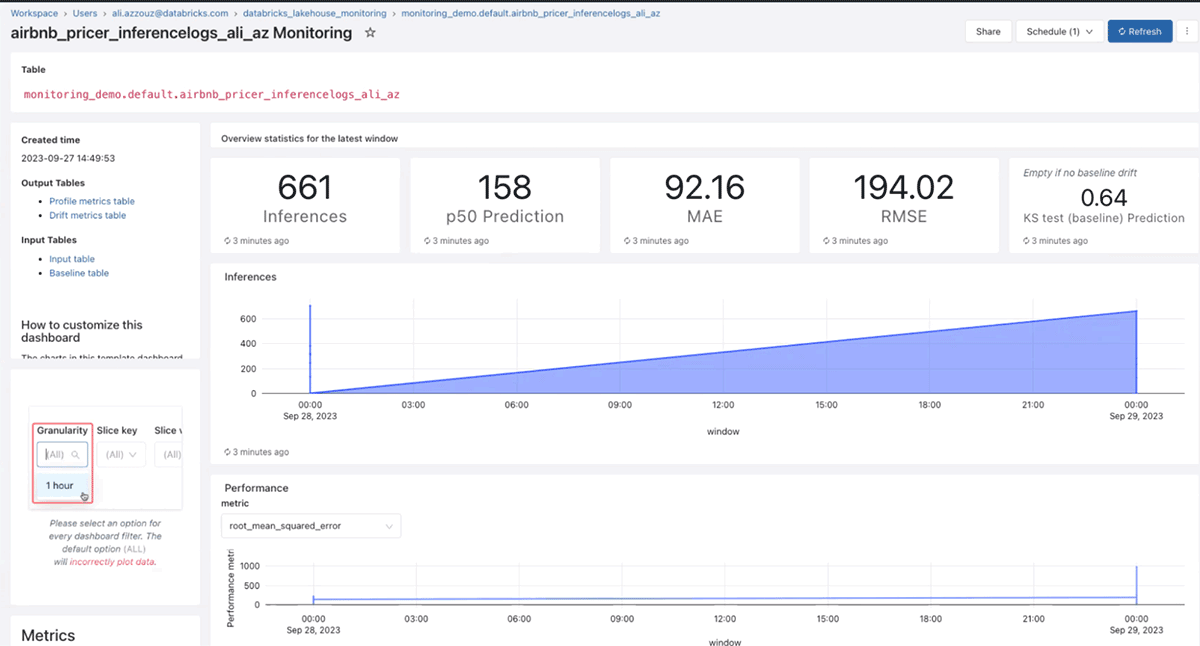
Below is a sample dashboard of the results of an ML model including its accuracy over time:
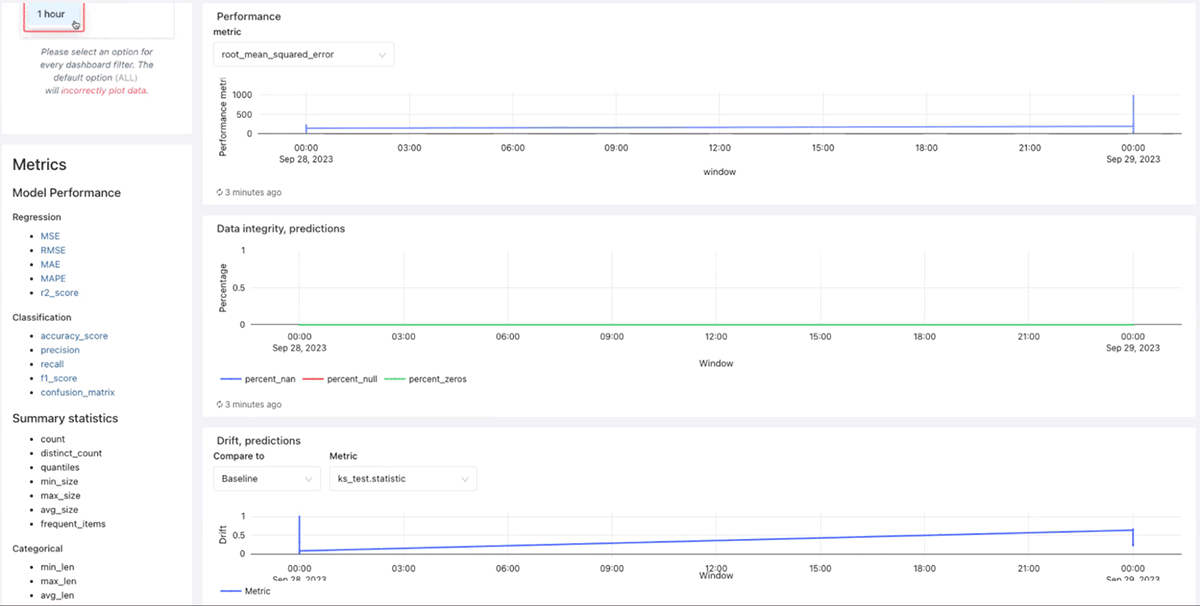
It further shows data integrity of predictions and data drift over time:
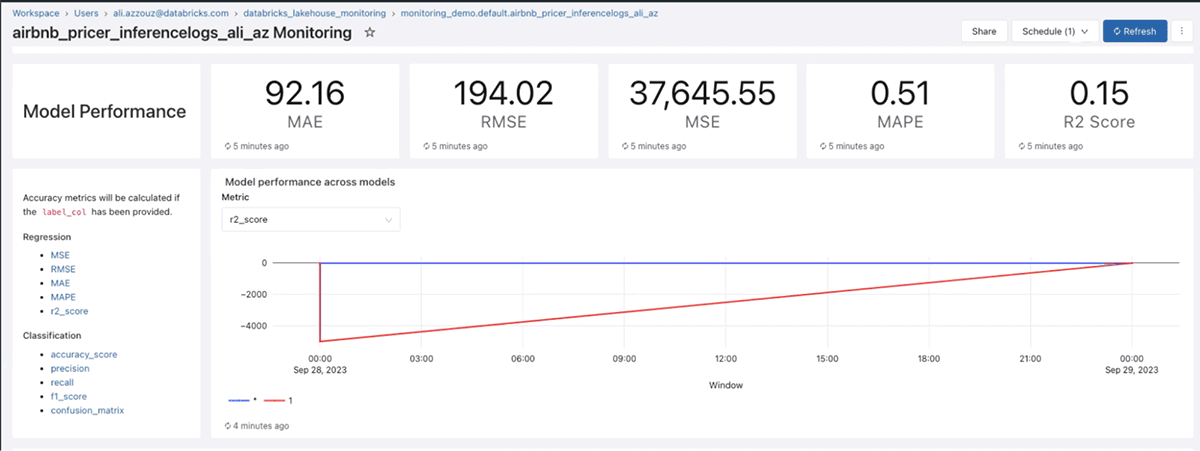
And model performance over time, according to a variety of ML metrics such as R2, RMSE, and MAPE:
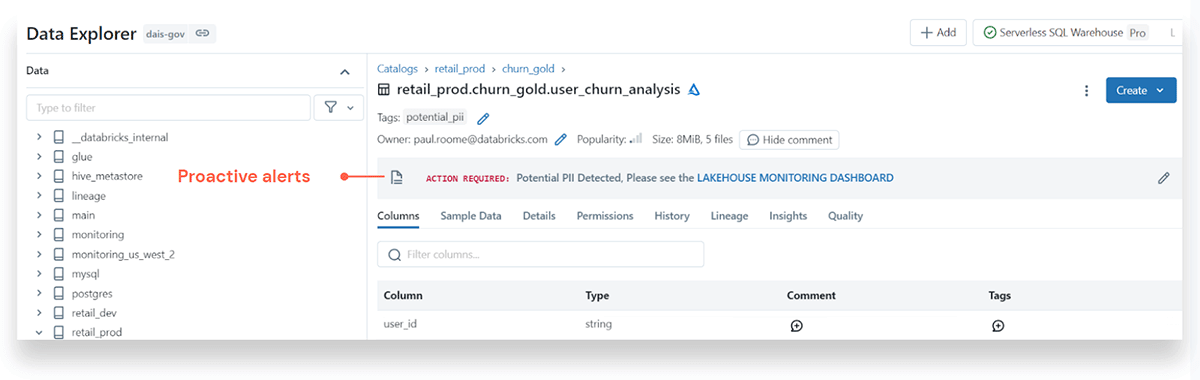
It's one thing to intentionally seek out ML model information when you are looking for answers, but it is a whole other level to get automated proactive alerts on errors, data drift, model failures, or quality issues. Below is an example alert for a potential PII (Personal Identifiable Information) data breach:
One more thing - you can assess the impact of issues, do a root cause analysis, and assess the downstream impact by Databrick's powerful lineage capabilities - from table-level to column-level.
System tables: metadata information for lakehouse observability and ensuring compliance
These underlying tables can be queried through SQL or activity dashboards to provide observability about every asset within the Databricks Intelligence Platform. Examples include which users have access to which data objects; billing tables that provide pricing and usage; compute tables that take cluster usage and warehouse events into consideration; and lineage information between columns and tables:
- Audit tables include information on a wide variety of UC events. UC captures an audit log of actions performed against the metastore giving administrators access to details about who accessed a given dataset and the actions that they performed.
- Billing and historical pricing tables will include records for all billable usage across the entire account; therefore you can view your account's global usage from whichever region your workspace is in.
- Table lineage and column lineage tables are great because they allow you to programmatically query lineage data to fuel decision making and reports. Table lineage records each read-and-write event on a UC table or path that might include job runs, notebook runs and dashboards associated with the table. For column lineage, data is captured by reading the column
- Node types tables capture the currently available node types with their basic hardware information outlining the node type name, the number of vCPUs for the instance, and the number of GPUs and memory for the instance. Also in private preview are node_utilization metrics on how much usage each node is leveraging.
- Query history holds information on all SQL commands, i/o performance, and number of rows returned.
- Clusters table contains the full history of cluster configurations over time for all-purpose and job clusters.
- Predictive optimization tables are great because they optimize your data layout for peak performance and cost efficiency. The tables track the operation history of optimized tables by providing the catalog name, schema name, table name, and operation metrics about compaction and vacuuming.
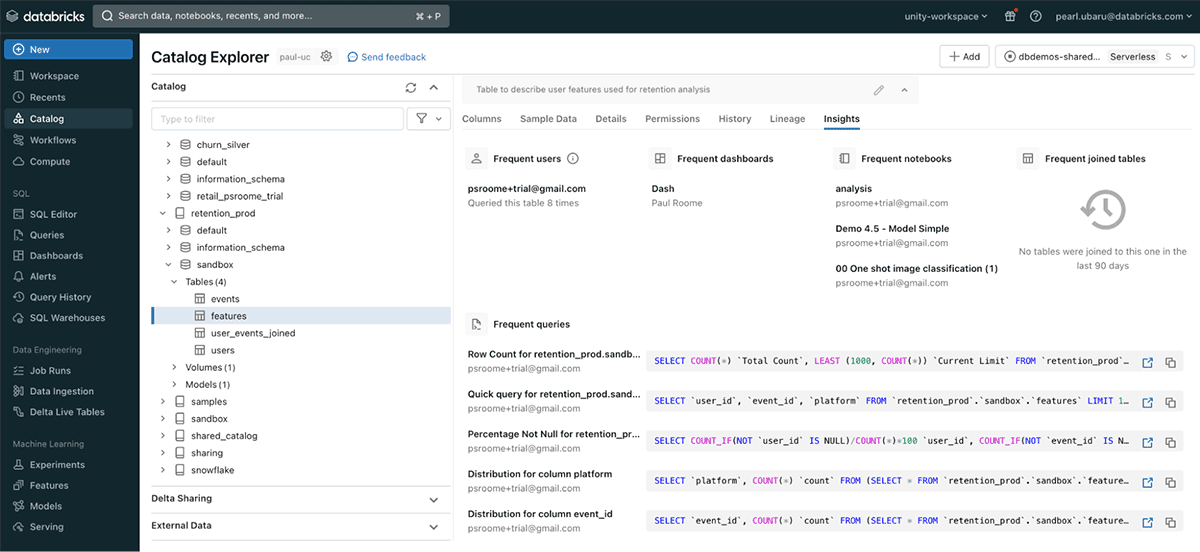
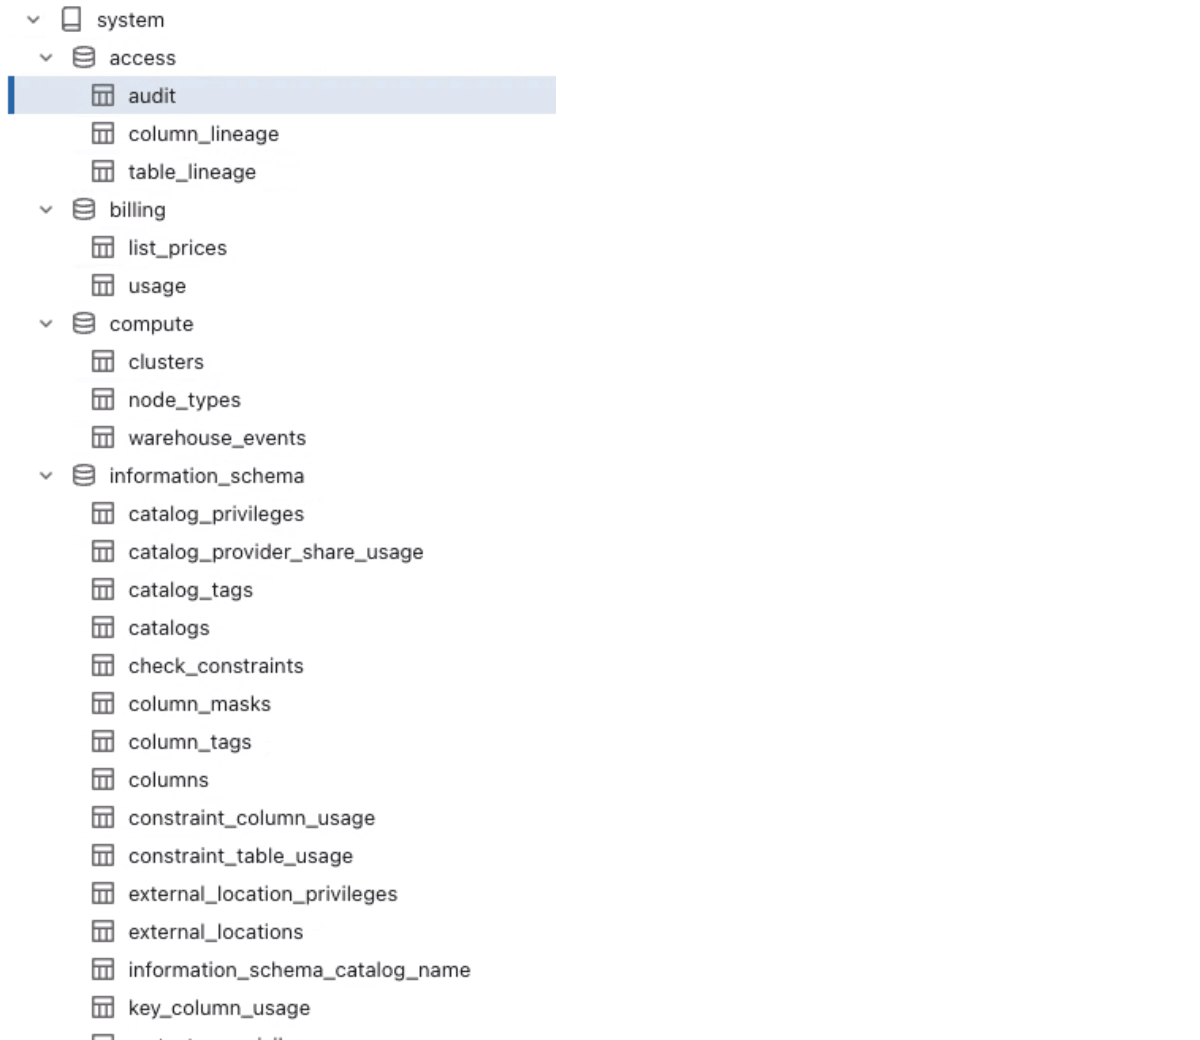
From the catalog explorer, here are just a few of the system tables any of which can be viewed for more details:
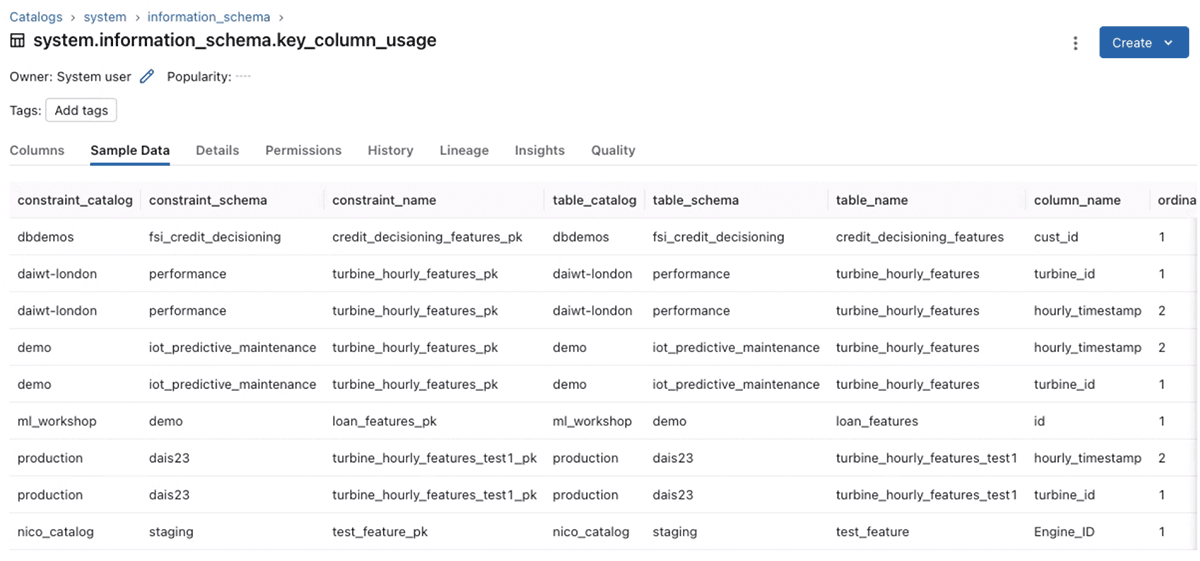
As an example, drilling down on the "key_column_usage" table, you can see precisely how tables relate to each other via their primary key:
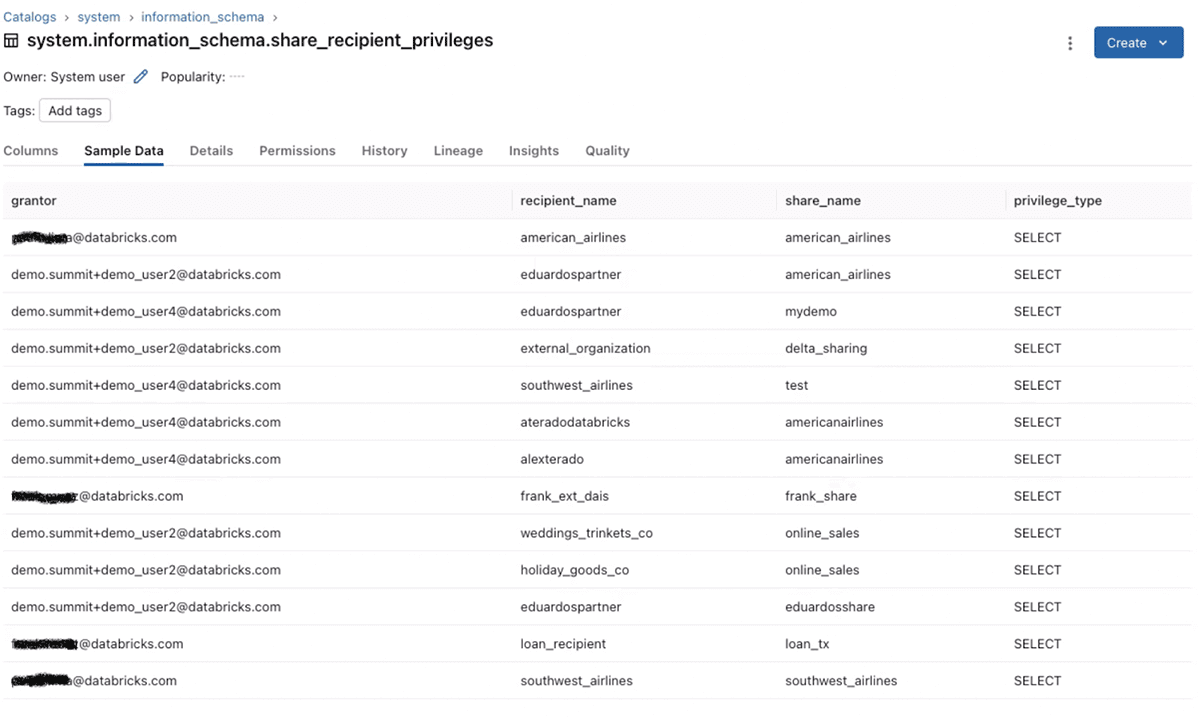
Another example is the "share_recipient_privileges" table, to see who granted which shares to whom:
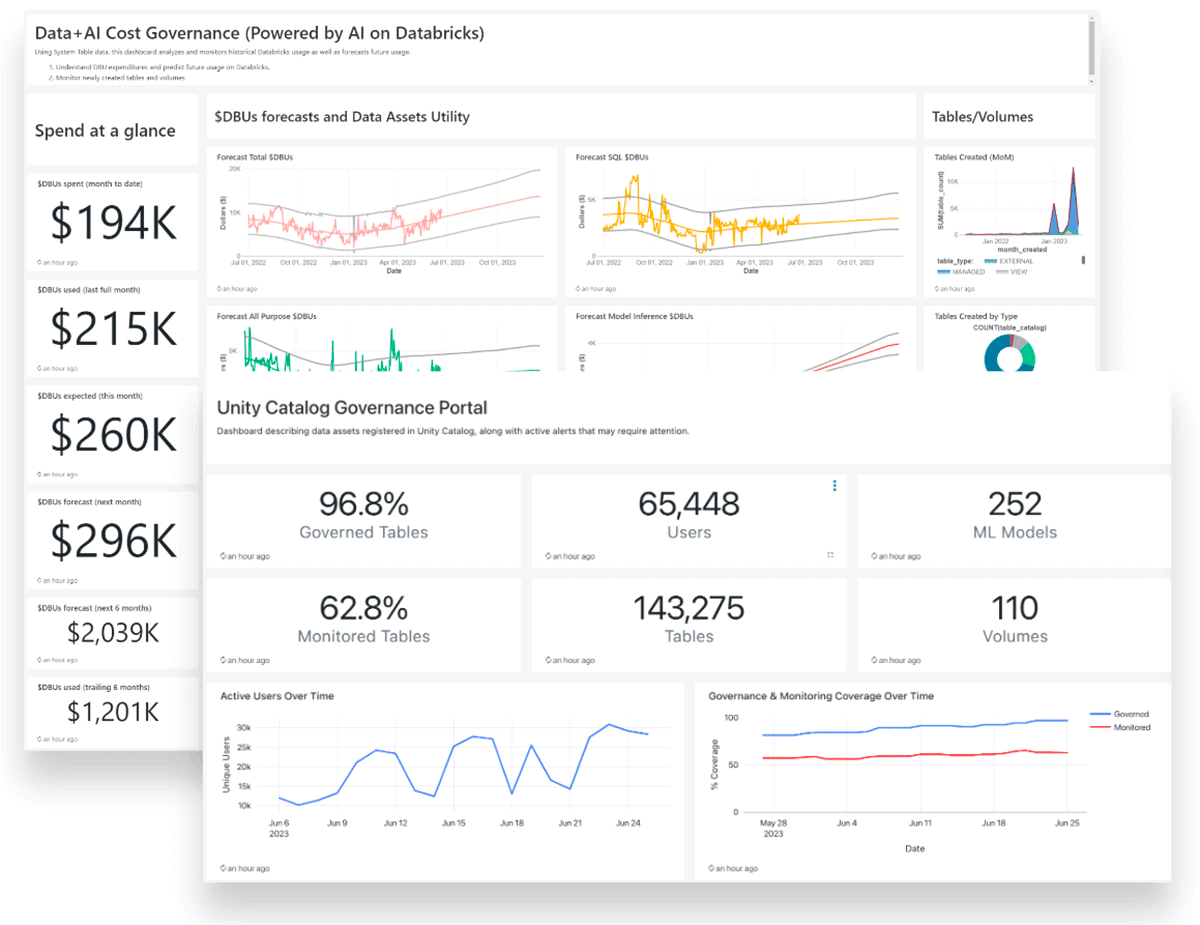
The example dashboard below shows the number of users, tables, ML models, percent of tables that are monitored or not, dollars spent on Databricks DBUs over time, and so much more:
What does having a comprehensive data and AI monitoring and reporting tool result in?
- Reduced risk of non-compliance with better monitoring of internal policies and security breach potential results in safeguarded reputation and improved data and AI trust from employees and partners.
- Improved integrity and trustworthiness of data and AI with "one source of truth", anomaly detection, and reliability metrics.
Value Levers with Databricks Unity Catalog
If you are looking to learn more about the values Unity Catalog brings to businesses, the prior Unity Catalog Governance Value Levers blog went into detail: mitigating risk around compliance; reducing platform complexity and costs; accelerating innovation; facilitating better internal and external collaboration; and monetizing the value of data.
Conclusion
Governance is key to mitigating risks, ensuring compliance, accelerating innovation, and reducing costs. Databricks Unity Catalog is unique in the market, providing a single unified governance solution for all of a company's data and AI across clouds and data platforms.
UC Databricks architecture makes governance seamless: a unified view and discovery of all data assets, one tool for access management, one tool for auditing for enhanced data and AI security, and ultimately enabling platform-independent collaboration that unlocks new business values.
Getting started is easy - UC comes enabled by default with Databricks if you are a new customer! Also if you are on premium or enterprise workspaces, there are no additional costs.
Get the latest posts in your inbox
Subscribe to our blog and get the latest posts delivered to your inbox.