7 Tips to Debug Apache Spark Code Faster with Databricks
by Vida Ha
Vida Ha is a lead solution architect at Databricks. She has over a decade of experience building big data applications at Google, Square, and Databricks. She is an early user of Apache Spark and has been helping Databricks customers building production applications for over two years.
In a perfect world, we all write perfect Apache Spark code and everything runs perfectly all the time, right? Just kidding - in practice, we know that working with large datasets is hardly ever that easy - there is inevitably some data point that will expose any corner cases with your code. Here are some tips for debugging your Spark programs with Databricks.
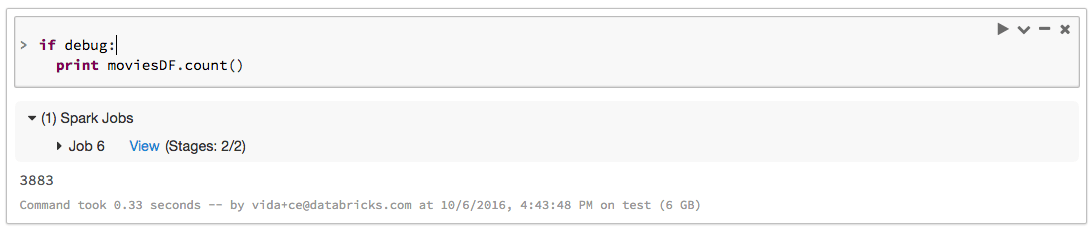
Tip 1: Use count() to call actions on intermediary RDDs/Dataframes.
While it's great that Spark follows a lazy computation model so it doesn't compute anything until necessary, the downside is that when you do get an error, it may not be clear exactly where the error in your code appeared. Therefore, you'll want to factor your code such that you can store intermediary RDDs / Dataframes as a variable. When debugging, you should call count() on your RDDs / Dataframes to see what stage your error occurred. This is a useful tip not just for errors, but even for optimizing the performance of your Spark jobs. It will allow you to measure the running time of each individual stage and optimize them.
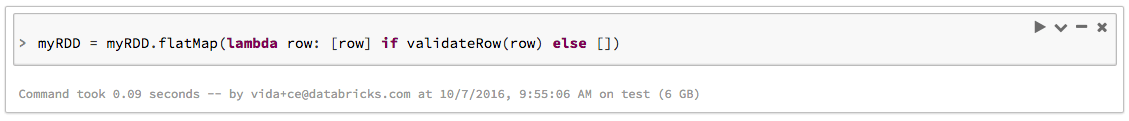
Tip 2: Working around bad input.
When working with large datasets, you will have bad input that is malformed or not as you would expect it. I recommend being proactive about deciding for your use case, whether you can drop any bad input, or you want to try fixing and recovering, or otherwise investigating why your input data is bad.
A filter command is a great way to get only your good input points or your bad input data (If you want to look into that more and debug). If you want to fix your input data or to drop it if you cannot, then using a flatMap() operation is a great way to accomplish that.
Tip 3: Use the debugging tools in Databricks notebooks.
The Databricks notebook is the most effective tool in Spark code development and debugging. When you compile code into a JAR and then submit it to a Spark cluster, your whole data pipeline becomes a bit of a black box that is slow to iterate on. The notebooks allow you to isolate and find the parts of your data pipeline that are buggy or slow, and it also allows you to quickly try different fixes. In Databricks, we have a number of additional built-in features to make debugging very easy for you:
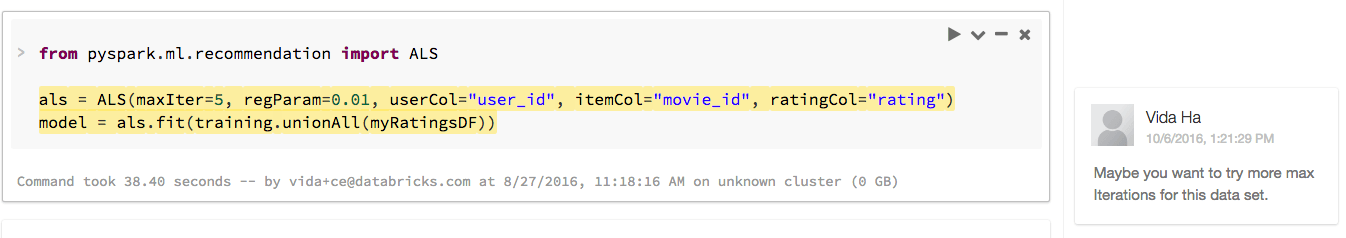
Commenting
Other users in your organization can comment on your code and suggest improvements. You could even do code reviews directly within notebooks or just share comments on the features.
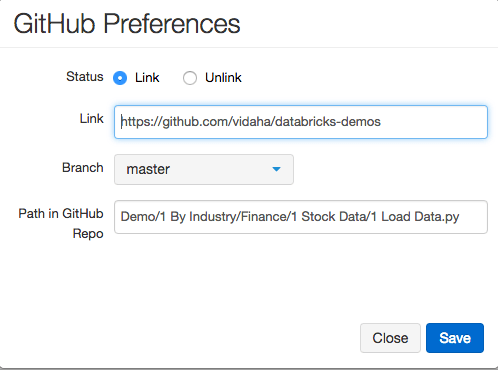
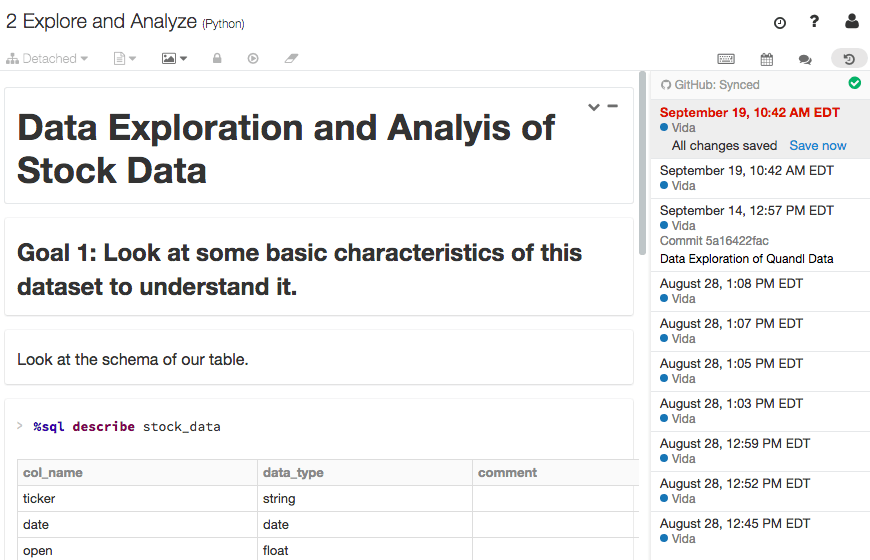
Version Control
Databricks notebooks have two different types of version control. The first is the traditional method of syncing your notebooks directly into GitHub.
The other is a history of what your notebook looked like at previous points in time, and allows you to revert to an older version with the click of a button.
Condensed view of the number of partitions.
When are you running a Spark Job, you can drill down and see the jobs and stages needed to run your job and how far along they are. In the workload below, for Stage 11, there are 200 partitions, 42 have completed, and 8 are currently running. If this stage were really slow, a larger Spark cluster would allow you to run more of the partitions at once and make the overall job finish faster.
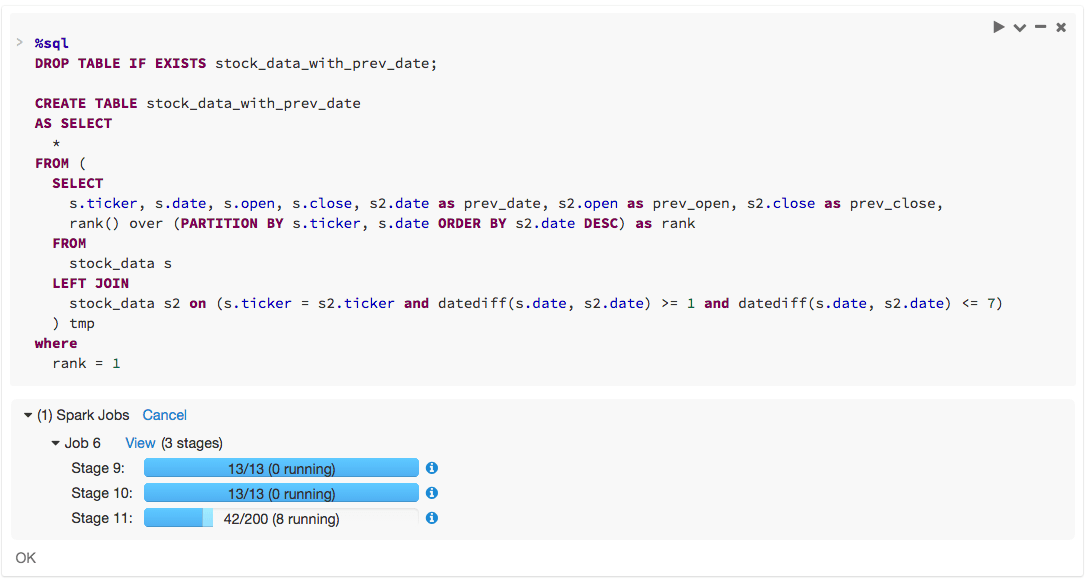
Spark UI Popout
If you click on the "View" link above for the job, the whole Spark UI will pop up for you to debug with. In tip #4, we'll cover the Spark UI. We did a blog on this feature, check it out for more details.
Tip 4: Understanding how to debug with the Databricks Spark UI.
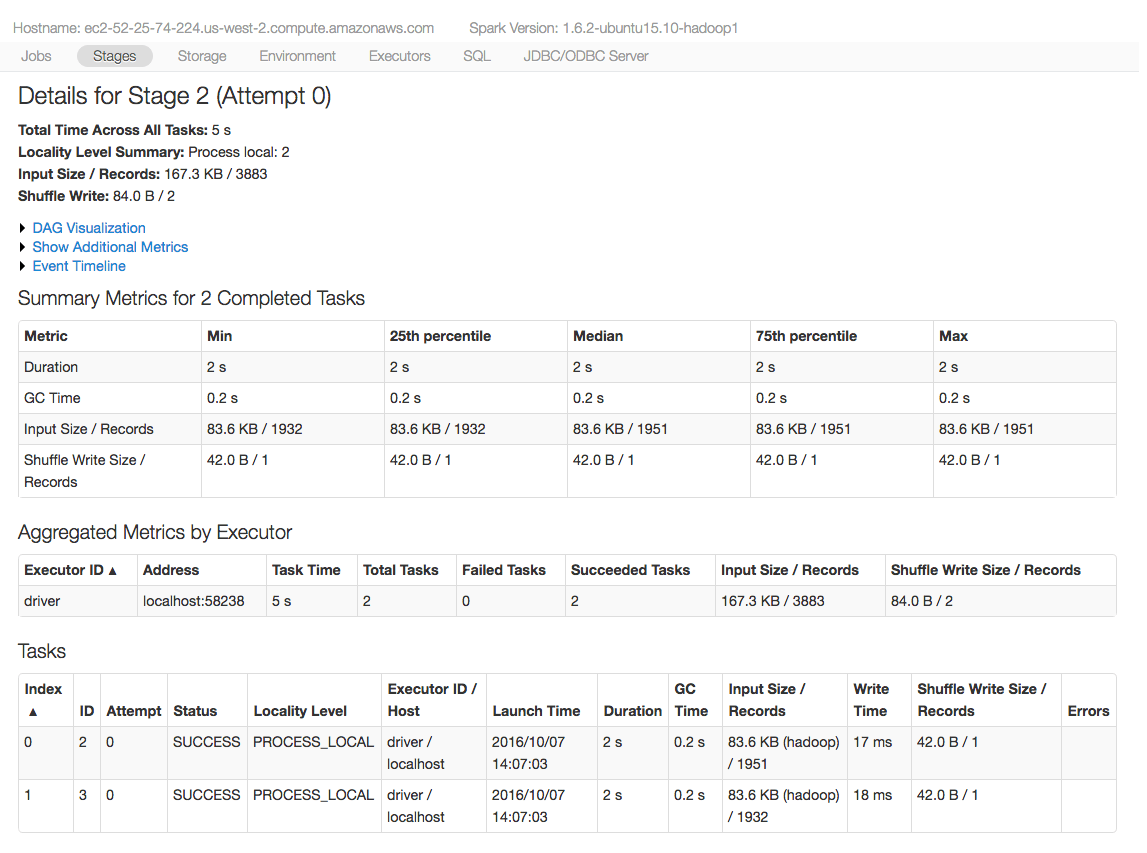
The Spark UI contains a wealth of information you can use for debugging your Spark jobs. There are a bunch of great visualizations, and we have a blog post here about those features.
Generally, I find the Spark UI intuitive to use. The only thing I see is that sometimes if a job fails, users will only look at the error that is thrown up to the cell in the notebook. When you have a Spark stage with a ton of tasks, if even a single task consistently fails, your whole job will fail. So, I advise drilling all the way down to the task page, sorting your page by the status, and examining the "Errors" column for the tasks that have failed. You'll get a detailed error message there. The task page is shown below - although the stage depicted here has completed successfully:
Tip 5: Scale up Spark jobs slowly for really large datasets.
If you have a really large dataset to analyze and run into errors, you may want to try debugging/testing on a portion of your dataset first. And then when you get that running smoothly, go back to the full dataset. Having a smaller dataset makes it quick to reproduce any errors, understand the characteristics of your dataset during various stages of your data pipeline, and more. Note - you can definitely run into more problems when you run the larger dataset - the hope is just that if you can reproduce the error at a smaller scale, it's easier for you to fix than if you needed the full dataset.
Tip 6: Reproduce errors or slow Spark jobs using Databricks Jobs.
As with any bug, having a reliable reproduction of the bug is half the effort of solving the bug. For that, I recommending reproducing errors and slow Spark jobs using the Databricks Jobs feature. This will help you capture the conditions for the bug/slowness and understand how flakey the bug is. You'll also capture the output permanently to look at - including the running times of each individual cell, the output of each cell, and any error message. And since our jobs feature contains a history UI, you can view any log files and the Spark UI even after your cluster has been shut down. You can also experiment with different Spark versions, instances types, cluster sizes, alternate ways to write your code, etc. in a very controlled environment to figure out how they affect your Spark job.
Tip 7: Examine the partitioning for your dataset.
While Spark chooses good reasonable defaults for your data, if your Spark job runs out of memory or runs slowly, bad partitioning could be at fault. For me, I start with trying different partitioning sizes to see how they affect your job.
If your dataset is large, you can try repartitioning to a larger number to allow more parallelism on your job. A good indication of this is if in the Spark UI - you don't have a lot of tasks, but each task is very slow to complete.
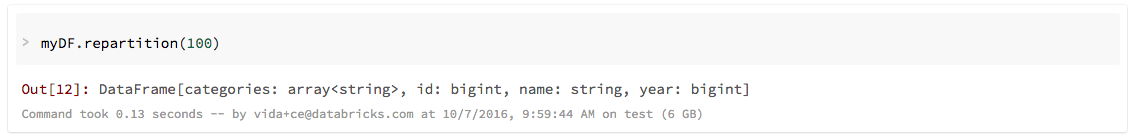
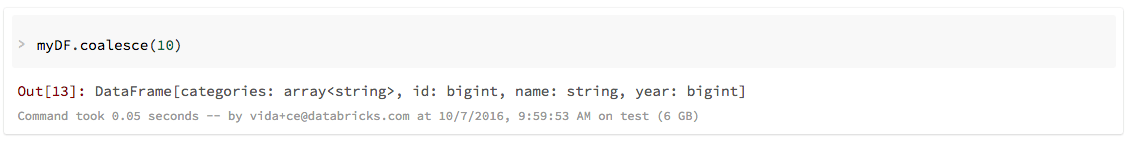
On the other hand, if you don't have that much data and you have a ton of partitions, the overhead of the having too many partitions can also cause your job to be slow. You can repartition to a smaller number, but coalesce may be faster since that will try to combine partitions on the same machines rather than shuffle your data around again.
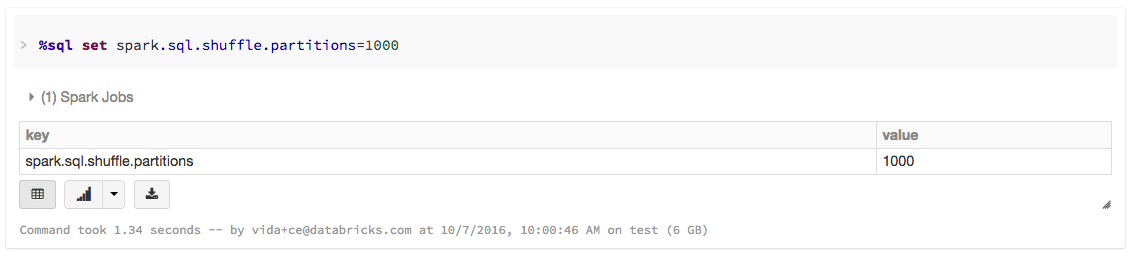
If you are using Spark SQL, you can set the partition for shuffle steps by setting spark.sql.shuffle.partitions.
What's Next
This is the first blog in a series on how to debug and optimize Apache Spark code on Databricks. To get notified when the next blog comes out, follow us on Twitter or subscribe to the newsletter.
If you are interested in trying Databricks, sign-up for a free trial or contact us.
Get the latest posts in your inbox
Subscribe to our blog and get the latest posts delivered to your inbox.