Automating ML, Scoring, and Alerting for Detecting Criminals and Nation States Through DNS Analytics
A modern approach to DNS threat detection
This blog is part two of our DNS Analytics blog, where you learned how to detect a remote access trojan using passive DNS (pDNS) and threat intel. Along the way, you’ll learn how to store, and analyze DNS data using Delta, Spark and MLFlow. In this blog post, we will show you how easy it is to train your model using Databricks AutoML, use Delta Live Tables to score your DNS logs, and how to generate Databricks SQL alerts on malicious domains scored by the model right into your inbox.
The Databricks Lakehouse Platform has come a long way since we last blogged about Detecting Criminals and Nation States through DNS Analytics back in June 2020. We’ve set world records, acquired companies, and launched new products that bring the benefits of the lakehouse architecture to whole new audiences like data analysts and citizen data scientists. The world has changed significantly too. Many of us have been working remotely for the majority of that time, and remote work has put increased dependency on the internet infrastructure. One thing has not changed - our reliance on the DNS protocol for naming and routing on the internet. This has led to Advanced Persistent Threat (APT) groups and cyber criminals leveraging DNS for command and control or beaconing or resolution of attacker domains. This is why academic researchers, industry groups and the federal government advise security teams to collect and analyze DNS events to hunt, detect, investigate and respond to new emerging threats and uncover malicious domains used by attackers to infiltrate networks. But you know, it's not as easy as it sounds.
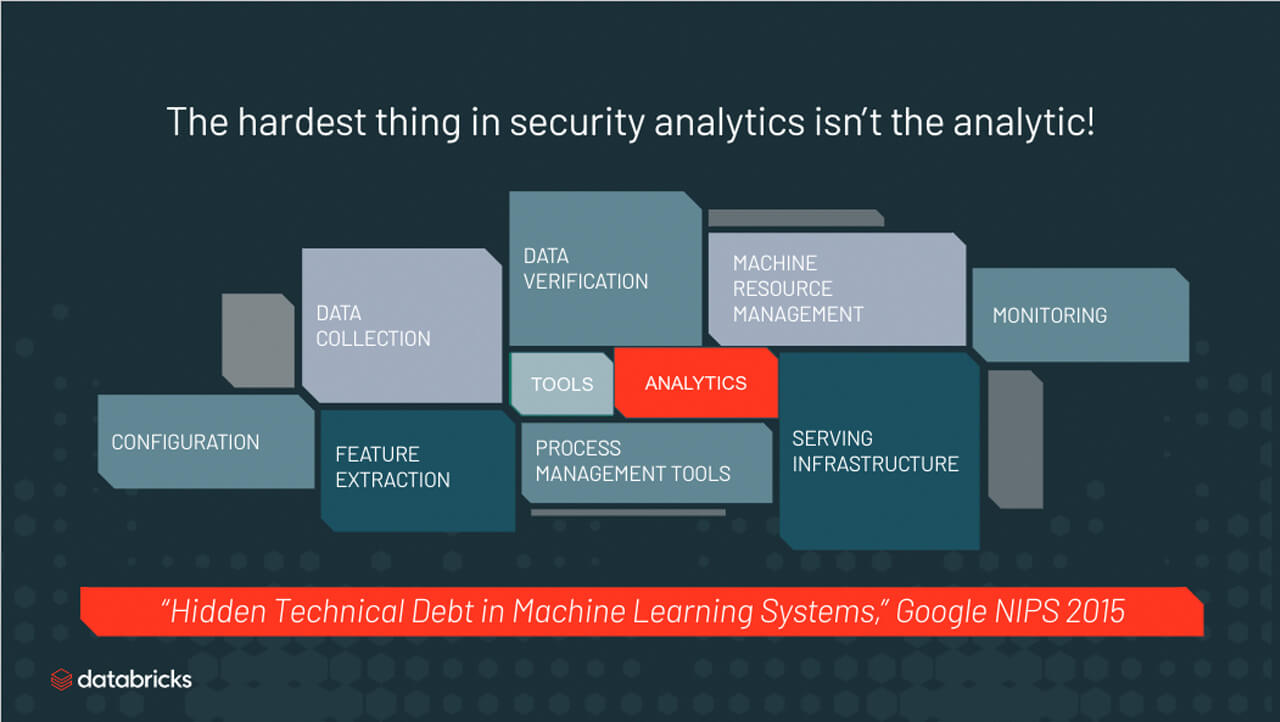
Figure 1.The Complexity, cost, and limitations of legacy technology make detecting DNS security threats challenging for most enterprise organizations.
Detecting malicious domains with Databricks
Using the notebooks below, you will be able to detect the Agent Tesla RAT. You will be training a machine learning model for detecting domain generation algorithms (DGA), typosquatting and performing threat intel enrichment using URLhaus. Along the way you will learn the Databricks concepts of:
- Data ingestion, enrichment, and ad hoc analytics with ETL
- Model building using AutoML
- Live scoring domains using Delta Live Tables
- Producing Alerts with Databricks SQL alerts
Why use Databricks for this? Because the hardest thing about security analytics isn’t the analytics. You already know that analyzing large scale DNS traffic logs is complicated. Colleagues in the security industry tell us that the challenges fall into three categories:
- Deployment complexity: DNS server data is everywhere. Cloud, hybrid, and multi-cloud deployments make it challenging to collect the data, have a single data store and run analytics consistently across the entire deployment.
- Tech limitations: Legacy SIEM and log aggregation solutions can’t scale to cloud data volumes for storage, analytics or ML/AI workloads. Especially, when it comes to joining data like threat intel enrichments.
- Cost: SIEMs or log aggregation systems charge by volume of data ingested. With so much data SIEM/log licensing and hardware requirements make DNS analytics cost prohibitive. And moving data from one cloud service provider to another is also costly and time consuming. The hardware pre-commit in the cloud or the capex of physical hardware on-prem are all deterrents for security teams.
In order to address these issues, security teams need a real-time data analytics platform that can handle cloud-scale, analyze data wherever it is, natively support streaming and batch analytics and, have collaborative content development capabilities. And… if someone could make this entire system elastic to prevent hardware commits… Now wouldn’t that be cool! We will show how Databricks Lakehouse platform addresses all these challenges in this blog.
Let us start with the high level steps of the detection process to execute the analytics. You can use the notebooks in your own Databricks deployment. Here is the high level flow in these notebooks:
- Read passive DNS data from AWS S3 bucket
- Specify the schema for DNS and load the data into Delta
- Enrich and prep the DNS data with a DGA detection model and GeoIP Enrichments
- Build the DGA detection model using Auto ML.
- Automate the DNS log scoring with DLT
- Produce Databricks SQL alerts
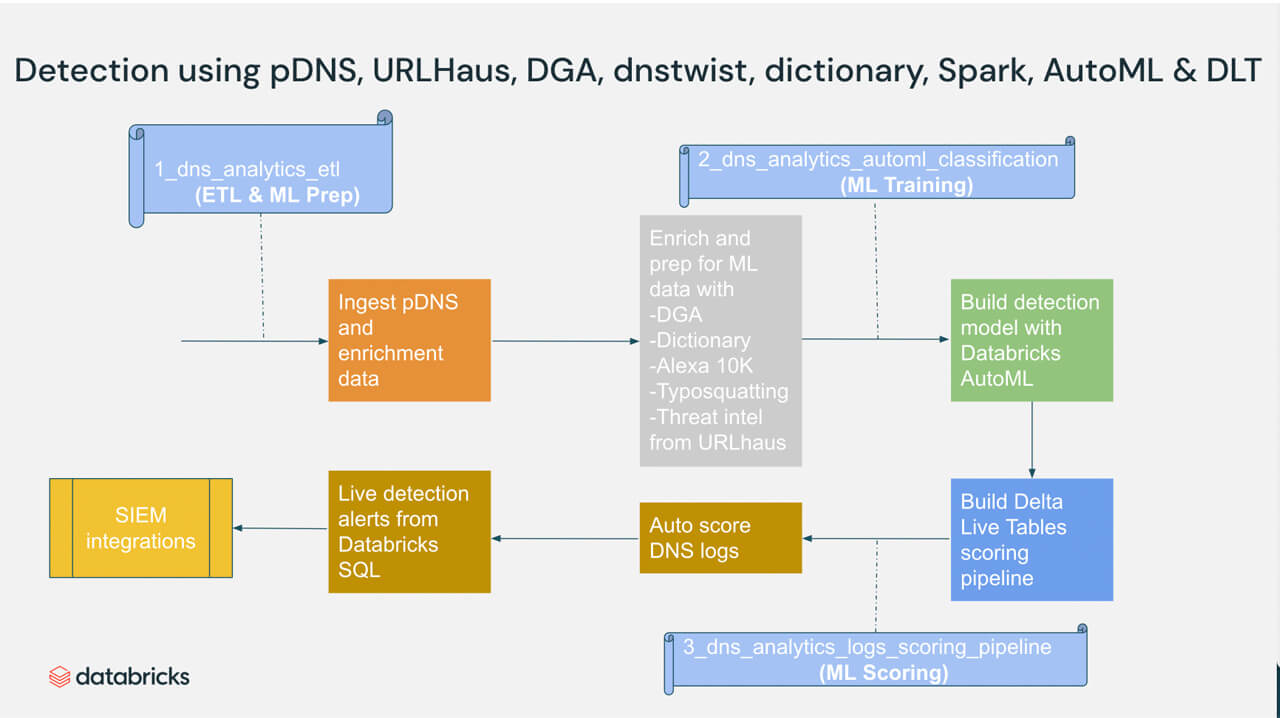
Figure 2. High level process showing how Databricks DNS analytics help detect criminal threats using pDNS, URLHaus, dnstwist, and Apache Spark
ETL & ML prep
In our previous blog post we extensively covered ETL and ML prep for DNS analytics. Each section of the notebook has comments. At the end of running this notebook, you will have a clean silver.dns_training_dataset table that is ready for ML training.
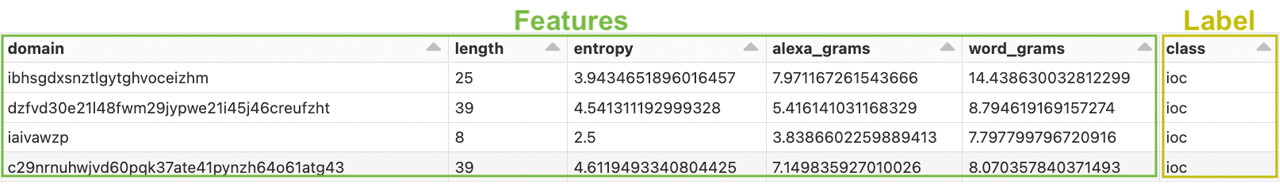
Figure 3. Clean DNS training data set with features and label
Automated ML training with Databricks AutoML
Machine Learning (ML) is at the heart of innovation across industries, creating new opportunities to add value and reduce cost, security analytics is no different. At the same time, ML is hard to do and it takes an enormous amount of skill and time to build and deploy reliable ML models. In the previous blog, we showed how to train and create the ML model for one type of ML model - the random forest classifier. Imagine, if we have to repeat that process for , say ten, different types of ML models so that we can find the best model (both type and parameters) – the Databricks AutoML lets us automate that process! Databricks AutoML — now generally available (GA) with Databricks Runtime ML 10.4 – automatically trains models on a data set and generates customizable source code, significantly reducing the time-to value of ML projects. This glass-box approach to automated ML provides a realistic path to production with low to no code, while also giving ML experts a jumpstart by creating baseline models that they can reproduce, tune, and improve. No matter your background in data science, AutoML can help you get to production machine learning quickly. All you need is a training dataset and AutoML does the rest. Let us use silver.dns_training_dataset that we produced in the previous step to automatically apply machine learning using the auto ml classification notebook.
AutoML automatically distributes hyperparameter tuning trials across the worker nodes of a cluster.
Each model is constructed from open source components and can easily be edited and integrated into your machine learning pipelines. You can use Databricks AutoML for regression, classification, and forecasting problems. It evaluates models based on algorithms from the scikit-learn, xgboost, and LightGBM packages.
We will use the dataset that was prepped using pDNS, URLHaus, DGA, dnstwist, alexa 10K, and dictionary in the ETL & ML Prep step. Each row in the table represents a DNS domain features and a class label as IoC or legit. The goal is to determine if a domain is IoC or not based on its domain name, domain length, domain entropy, alexa_grams, and word_grams.
Figure 4. CMD3 of notebook 2_dns_analytics_automl_classification showing loading the training data set into a spark dataframe
The following command splits the dataset into training, validation and test sets. Use the randomSplit method with the specified weights and seed to create dataframes storing each of these datasets
Figure 5. CMD4 of notebook 2_dns_analytics_automl_classification showing splits the dataset into training, validation and test sets
The following command starts an AutoML run. You must provide the column that the model should predict in the target_col argument.
When the run completes, you can follow the link to the best trial notebook to examine the training code. This notebook also includes a feature importance plot.
Figure 6. CMD4 of notebook 2_dns_analytics_automl_classificationshowing starting and AutoML run
AutoML prepares the data for training, runs data exploration, trials multiple model candidates, and generates a Python notebook with the source code tailored to the provided dataset for each trial run. It also automatically distributes hyperparameter tuning and records all experiment artifacts and results in MLflow. It is ridiculously easy to get started with AutoML, and hundreds of customers are using this tool today to solve a variety of problems.
At the end of running this notebook you will have the “best model” that you can use for inference. It's that easy to build a model with Databricks AutoML.
Easy & reliable DNS log processing with Delta Live Tables
We’ve learned from our customers that loading, cleaning and scoring DNS logs and turning into production ML pipelines typically involves a lot of tedious, complicated operational work. Even at a small scale, the majority of a data engineer’s time is spent on tooling and managing infrastructure rather than transformation. We also learned from our customers that observability and governance were extremely difficult to implement and, as a result, often left out of the solution entirely. This led to spending lots of time on undifferentiated tasks and led to data that was untrustworthy, not reliable, and costly.
In our previous blog, we showed how to perform the loading and transformation logic in vanilla notebooks - imagine if we can simplify that and have a declarative deployment approach with it. Delta Live Tables (DLT) is the first framework that uses a simple declarative approach to building reliable data pipelines and automatically managing your infrastructure at scale so data analysts and engineers can spend less time on tooling and focus on getting value from data. With DLT, engineers are able to treat their data as code and apply modern software engineering best practices like testing, error handling, monitoring and documentation to deploy reliable pipelines at scale. DLT was built from the ground up to automatically manage your infrastructure and to automate complex and time-consuming activities. DLT automatically scales compute infrastructure by allowing the user to set the minimum and maximum number of instances and let DLT size up the cluster according to cluster utilization. In addition, tasks like orchestration, error handling and recovery are all done automatically — as is performance optimization. With DLT, you can focus on data transformation instead of operations.
And because the ETL pipelines that process security logging will benefit greatly from the reliability, scalability and built-in data quality controls that DLT provides, we’ve taken the ETL pipeline shared as part of our previous blog and converted it to DLT.
This DLT pipeline reads your DNS event logs from cloud object storage into your lakehouse and scores those logs using the model that was trained in the previous section.
Figure 7. CMD3 of notebook 3_dns_analytics_logs_scoring_pipeline showing reading DNS logs events from cloud storage and scoring with ML model
To get the new DLT pipeline running on your environment, please use the following steps:
- Create a new DLT pipeline, linking to the shared_include and 3_dns_analytics_logs_scoring_pipeline notebook (see the docs for AWS, Azure, GCP). You’ll need to enter the following configuration options:
- a. dns.dns_logs: The cloud storage path that you’ve configured for DNS logs that need to be scored. This will usually be a protected storage account which isn’t exposed to your Databricks users.
b. dns.model_uri: The best model path that was created as part of the ML Training step. This is readily available to copy paste from Cmd 19 out of the notebook 2_dns_analytics_automl_classification.py.
Your DLT configuration should look something like this:
- a. dns.dns_logs: The cloud storage path that you’ve configured for DNS logs that need to be scored. This will usually be a protected storage account which isn’t exposed to your Databricks users.
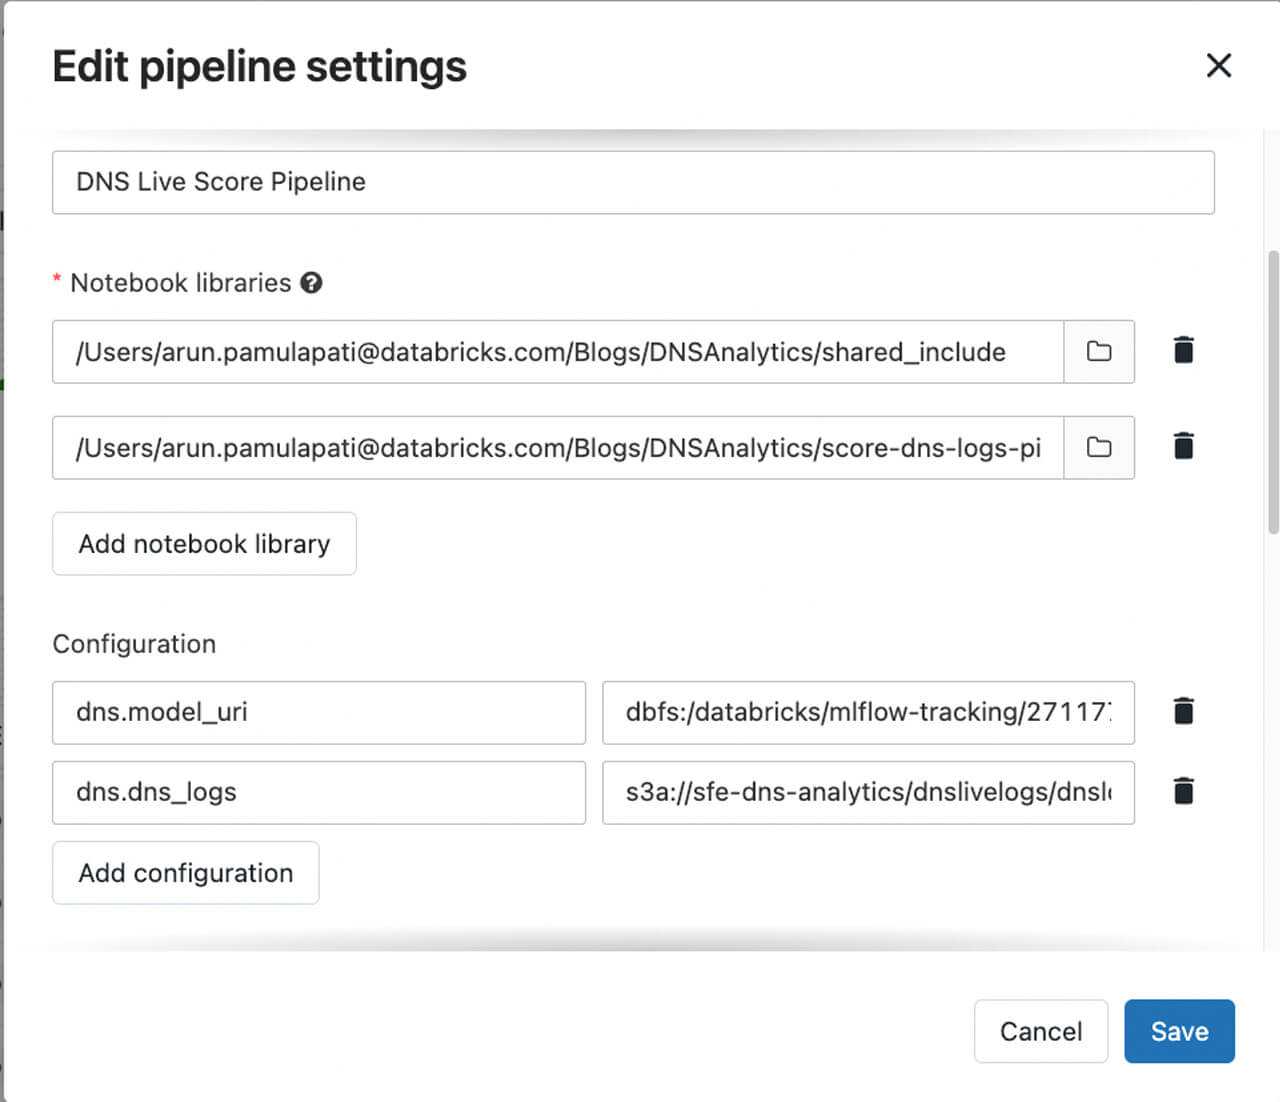
Figure 8. DLT pipeline configuration example with notebooks and parameters.
- Now you should be ready to configure your pipeline to run based on the appropriate schedule and trigger. Once it has run successfully, you should see something like this:
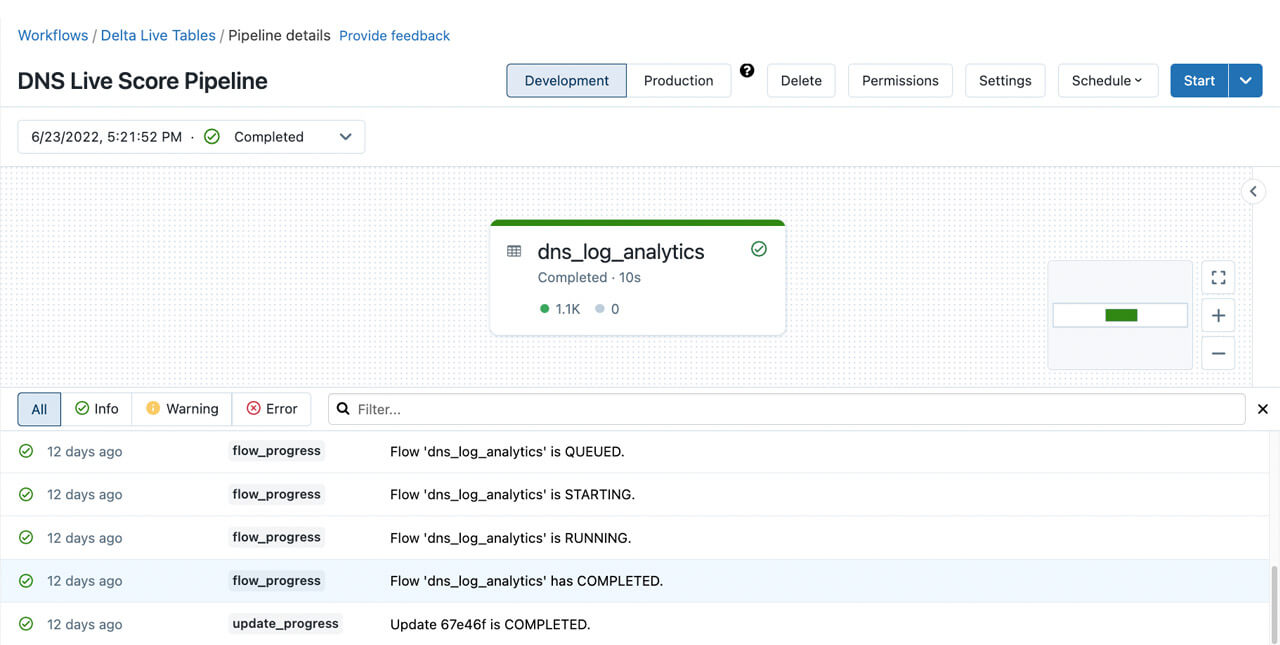
Figure 8. DLT pipeline execution example
At the end of running this DLT pipeline, you will have a dns_logs.dns_log_analytics table with a row for each dns log and a column as class indicating if the domain is scored as IoC or not.
Easy dashboarding and alerting with Databricks SQL
Now that you’ve ingested, transformed and perform ML-based detections on your DNS logs in the Lakehouse, what can you do with the results next? Databricks SQL is a net-new capability since our previous blog that lets you write and perform queries, create dashboards, and setup notifications easily with awesome price-performance. If you navigate to the Data Explorer (see the docs for AWS, Azure) you’ll find the dns_log_analytics table in the target database you specified within the DLT configuration above.
Potential use cases here might be anything from ad-hoc investigations into potential IoCs, to finding out who’s accessing malicious domains from your network infrastructure. You can easily configure Databricks SQL alerts to notify you when a scheduled SQL query returns a hit on one of these events.
- We will make the queries time bound (I.e. by adding a
timestamp >= current_date() - 1)to alert on the current date. - We will use the query to return a count of IoCs (I.e. by adding a
COUNT(*)and an appropriateWHEREclause) - Now we can configure an alert to run every day and trigger if the count of IoCs is > 0
- For more complicated alerting based on conditional logic, consider the use of
CASEstatements (see the docs for AWS, Azure)
For example, the following SQL queries could be used to alert on IoCs :
Figure 9. A simple SQL query to find all the IoC domains found on a given day.
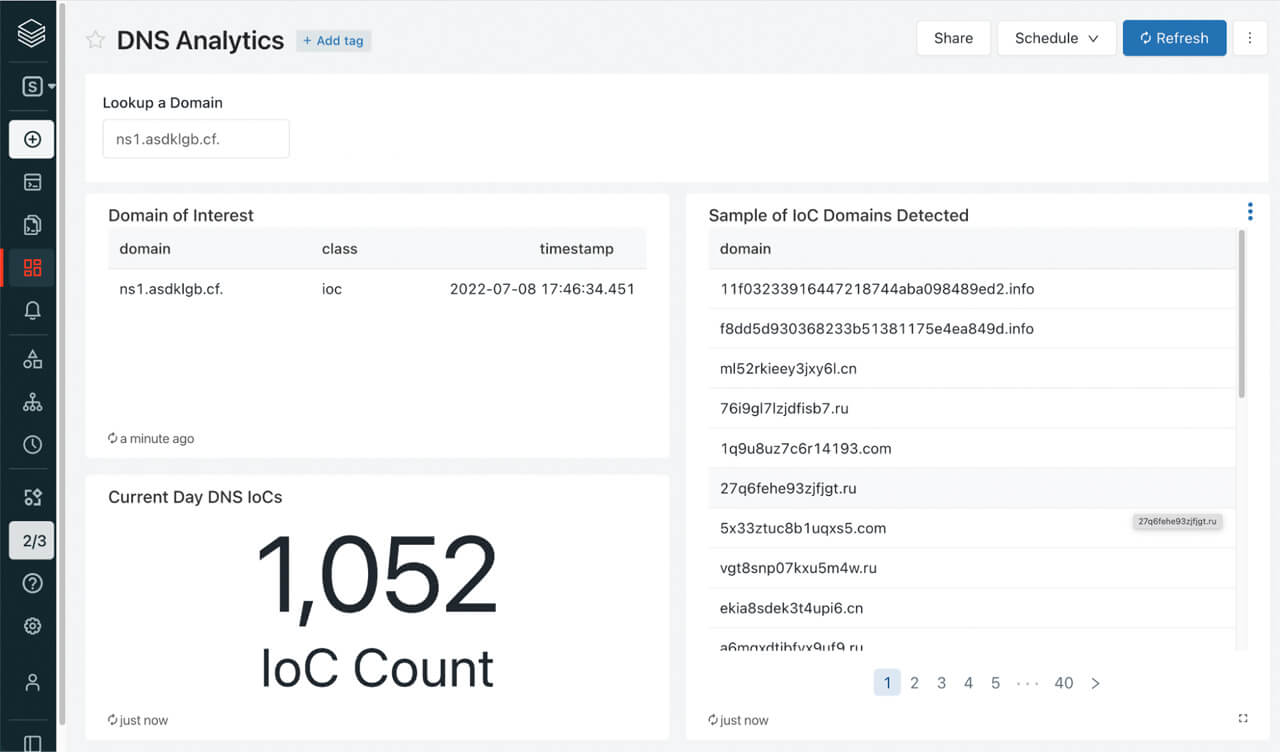
Sample dashboard enabling security analysts to search for a specific domain in a pile of potential IoCs, get a count of potential IoCs seen on a given day and also get a full list of potential IoC domains seen on a given day.
These could be coupled with a custom alert template like the following to give platform administrators enough information to investigate whether the acceptable use policy has been violated:
Hello,

Alert "{{ALERT_NAME}}" changed status to {{ALERT_STATUS}}.

There have been the following unexpected events on the last day:

{{QUERY_RESULT_ROWS}}
Check out our documentation for instructions on how to configure alerts (AWS, Azure), as well as for adding additional alert destinations like Slack or PagerDuty (AWS, Azure).
Conclusion
In this blog post you learned how easy it is to ingest, ETL, prep for ML, train models, and live score DNS logs in your Databricks Lakehouse. You also have an example of detection to hunt for signs of compromise within the DNS events and setup alerts to get notifications.
What’s more, you can even query the Lakehouse via your SIEM tool.
We invite you to log in to your own Databricks account and run these notebooks. Please refer to the docs for detailed instructions on importing the notebook to run.
We look forward to your questions and suggestions. You can reach us at: [email protected]. Also if you are curious about how Databricks approaches security, please review our Security & Trust Center.
Get the latest posts in your inbox
Subscribe to our blog and get the latest posts delivered to your inbox.