Using Abandoned Cropland for Carbon Sequestration: a Data-driven Approach
Using the Lakehouse to improve the ease of data management and model development to combat climate change
by Sam Raymond and Prof. Cesar Terrer
This is a collaborative post from Databricks and MIT. We thank Cesar Terrer, Assistant Professor at MIT, Civil and Environmental Engineering Department (CEE), for his contributions.
Climate change has a data problem. Carbon sequestration projects have shown promise in the fight against increasingly extreme weather patterns. However, the most effective use of this novel technology demands strong data modeling capabilities executed against complex environmental data. Solving climate change demands collaboration across academic, non-profit, government, and private sector stakeholders. With a more effective use of data, these groups can better collaborate to more effectively operationalize crucial interventions such as carbon sequestration.
The Terrer Lab at MIT is tackling this data problem with the chronobase, a curated dataset that serves as a key source of information for potential carbon sequestration locations. This blog post will walk through the chronobase database and how the Terrer Lab team uses it with the Databricks Lakehouse architecture to drive critical use cases.
The chronobase dataset
The chronobase dataset is a critical source of information on the potential of abandoned cropland for carbon sequestration. Carbon sequestration is the process of capturing, securing and storing excess carbon dioxide from the atmosphere, with the goal of stabilizing carbon in solid and dissolved forms so that it does not lead to further atmospheric warming. For natural processing like soil carbon sequestration, this involves absorbing carbon into the solid-based organic material.
Creating a database that reflected the potential of soils from abandoned croplands to absorb carbon dioxide, the chronobase, meant managing data that was scattered amongst hundreds sources, requiring many painstaking hours of manual consolidation. This scattering prevented the development of data-driven models that could support sequestration efforts. Without an integrated data model for the complex task of analyzing carbon sequestration initiatives, they risk being less impactful. Arguably, the most important variable in the chronobase dataset is the measured soil carbon content at two different points in time at specified depths. This allows a calculation of how much carbon has been extracted from the soil from farming activity, and the potential available sequestration capacity.
The ultimate use of the chronobase dataset and its machine learning (ML) model is to help stakeholders collaborate in managing abandoned cropland to maximize the carbon sequestration potential. This entails not only having data and models, but being able to make these accessible to all organizations and individuals to develop strategies for using cropland to combat climate change.
Bringing the chronobase to the Lakehouse
Together with Databricks, researchers in the MIT Terrer Lab brought the chronobase to the Lakehouse and built an ML model to predict the sequestration potential of croplands across North America. By leveraging the seamless connection to data ingesting, ETL, and model creation, this project served as a blueprint for how the Lakehouse can be used in climate science with complex data. With the pathological issues inherent in climate data – siloing, lack of visibility, incompatible schemas, archaic storage formats, and the need for complex models – the Lakehouse architecture simplifies and enriches this workflow.
Along the way to building and deploying the model, we will identify various Lakehouse features used to ingest, catalog, analyze, and share the data.
Step 1: Uploading the Chronobase data to Databricks.
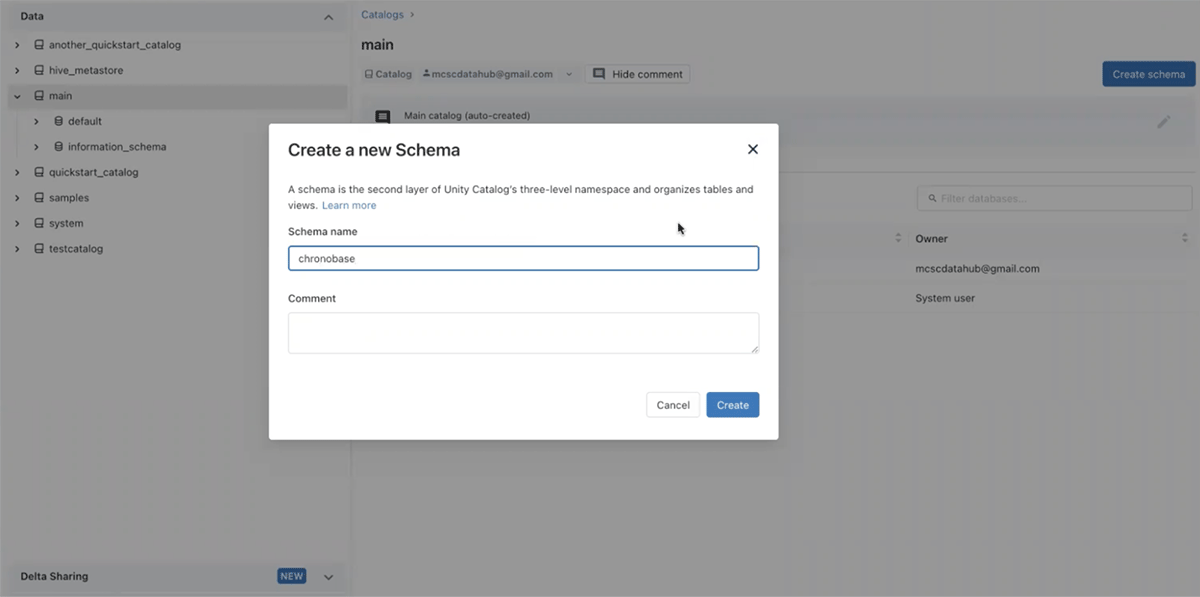
The Databricks Unity Catalog is a unified governance solution for all data and AI assets including files, tables, ML and dashboards in the Lakehouse, available on any cloud. We will create a new schema for the chronobase data, which will further allow us to manage data sharing across different groups. Storing the data in Unity Catalog brings an array of benefits, ranging from easy declarative access governance to data exchange service, and perhaps also link Delta Sharing.
Step 2: Populate Schema.
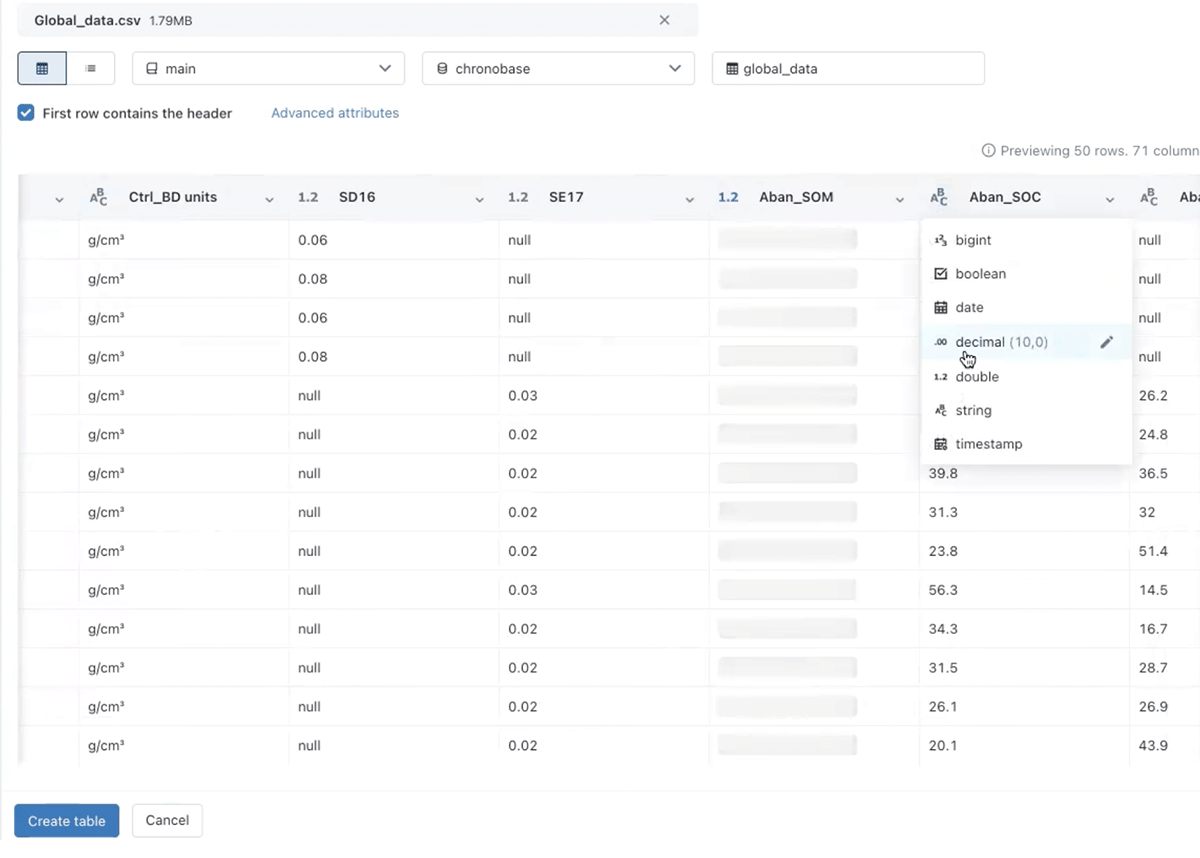
There are a few ways to ingest the chronobase dataset. For our purposes, we simply use the new Add Data UI. We could also easily stream in updated data as needed, as well to keep our database fully up to date in the Lakehouse and connect to other data sources to enrich the dataset, which is the goal for this project in the future.
Step 3: Exploratory Analysis.
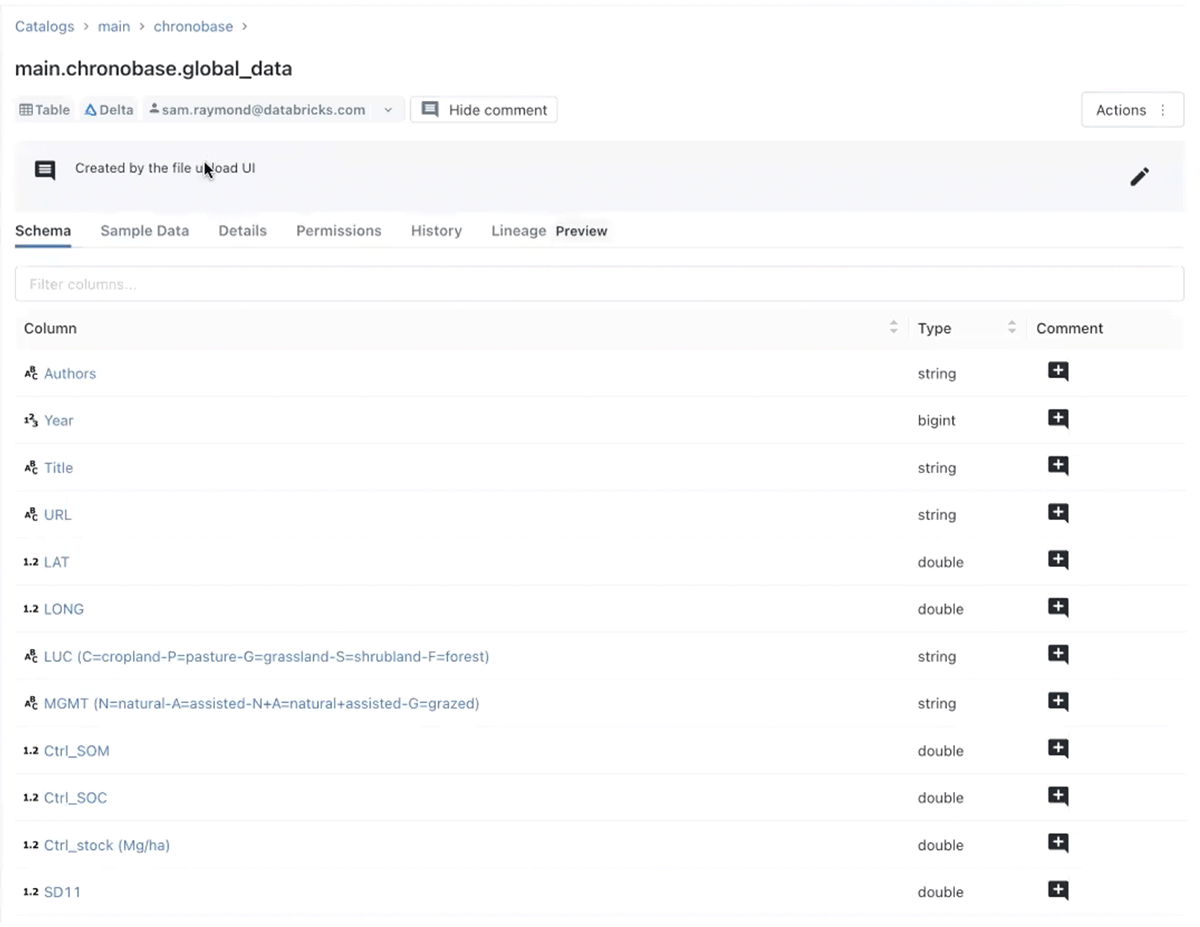
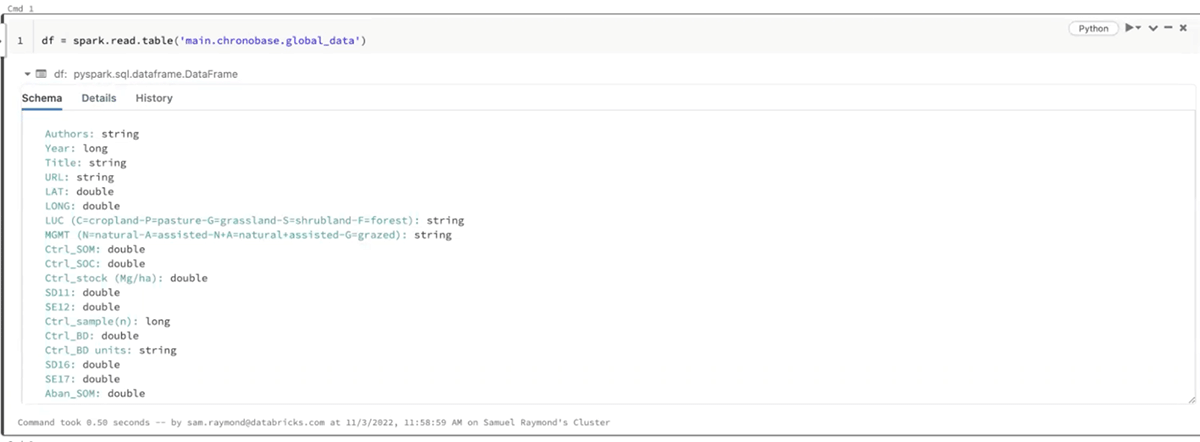
In order to build an ML model, we need to understand the underlying data. This is easily accomplished within Databricks' interactive and collaborative Notebooks, where we can quickly read from our Database and use an optimized Spark API to perform initial exploratory data analysis. We could also have run queries using DBSQL which is a more pure data warehouse API.
Step 4: Visualizing the Chronobase Data.
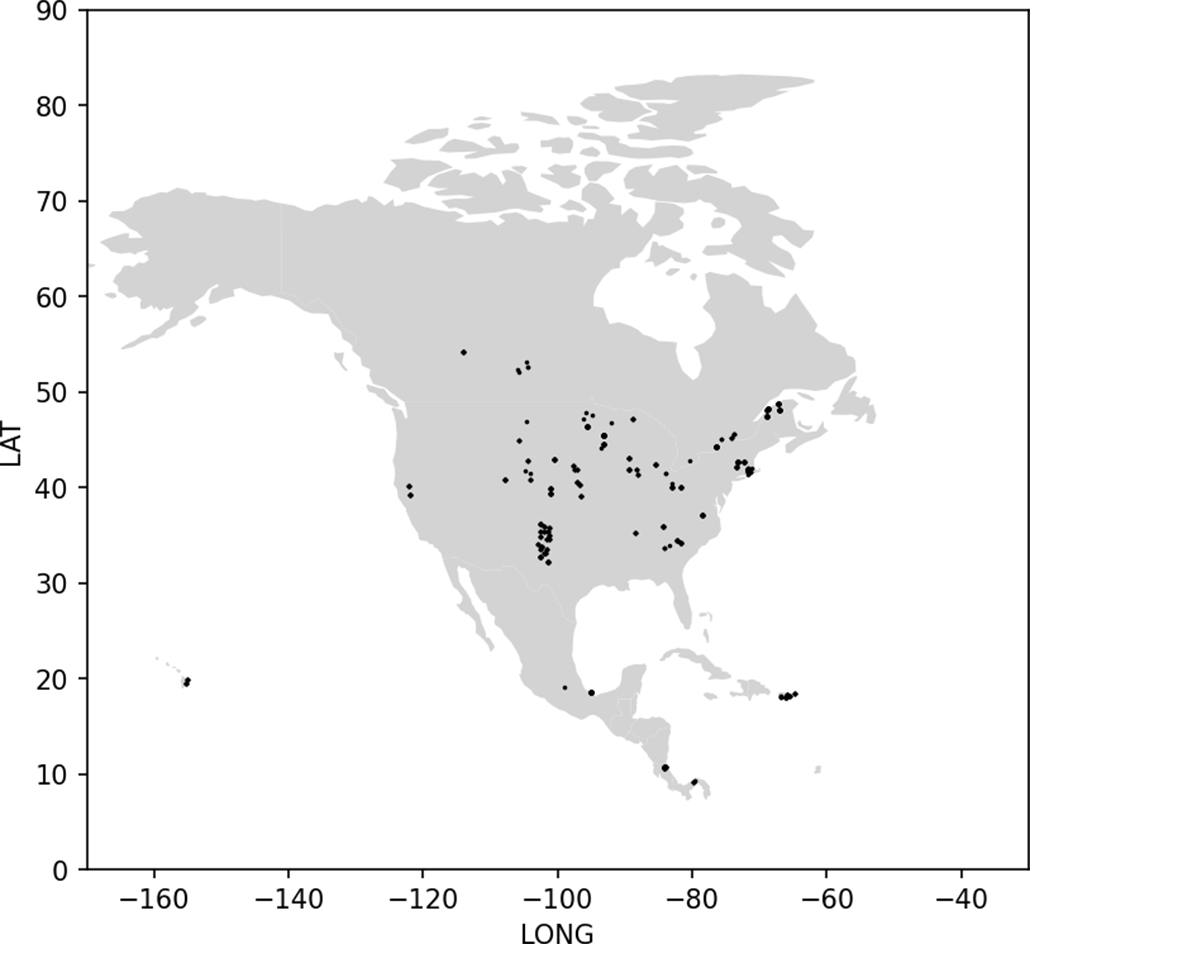
On the Databricks platform there are many ways to render geospatial data (eg. Mosaic, geopandas, etc.). For our initial proof-of-concept purposes, we used the geopandas python library to visualize some of the data across North America. This allowed us to make sure our latitude / longitude coordinates were as expected and get a sense of the relative sparseness and density of the geographic locations. Moving forward, this geospatial data will be managed with the new geospatial library, Mosaic, built on top of Apache Spark. Plotting the data on the North American continent, we can see the clusters of where this data was collected. With the vast array of different ecological conditions present even within a few square miles, data from all over the continent can inform various types of ecological environments. This data is typically from locations that are well-known agricultural regions, but can be extended to any arable land.
Step 5: Build & Training a Baseline Model.
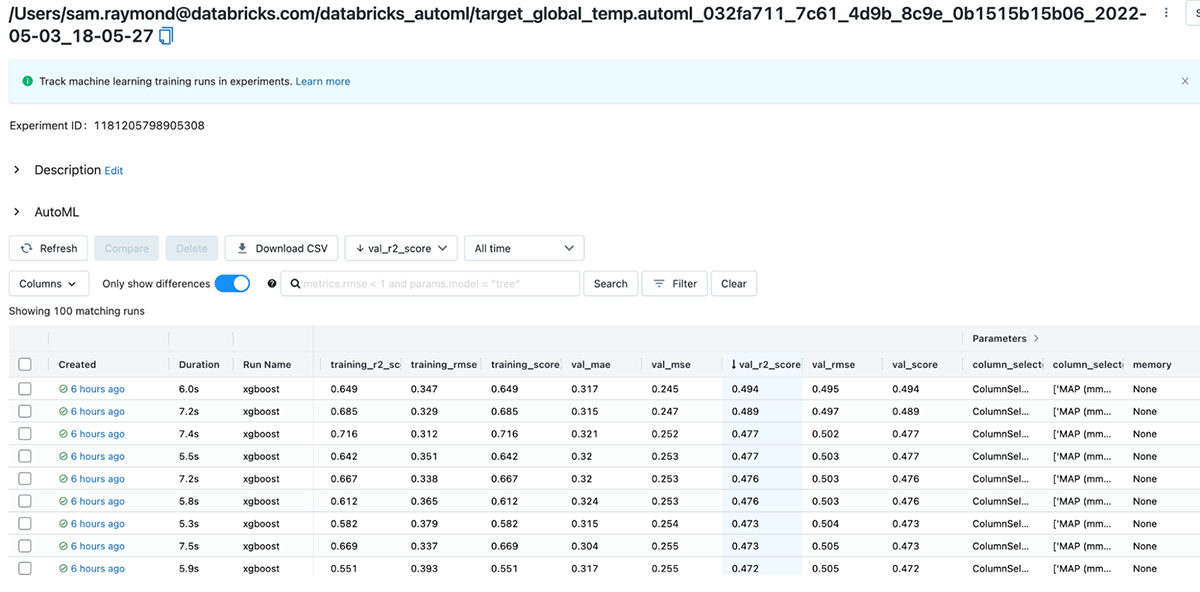
Within Databricks, the AutoML feature allows us to quickly generate baseline models and notebooks. If needed, those with more ML expertise can accelerate their workflow by fast-forwarding through the usual trial-and-error and focus on customizations using their domain knowledge. For this initial approach, we applied AutoML to predict the rate of carbon sequestration with the variables in the chronobase. This took a more citizen data scientist path and we were able to get to usable results with a low-code approach. Our baseline model predicted the relative growth of carbon based on the surrounding carbon capacity of soils, the annual average temperature and rainfall, latitude and longitude, as well as how long the land is left to absorb carbon dioxide. The best model chosen by the AutoML was an XGBoost model with a validation R2 value of 0.494. For ecological models, with such a vast array of unmeasured properties, lower R2 scores are commonplace.
Step 6: Creating New Data to Test.
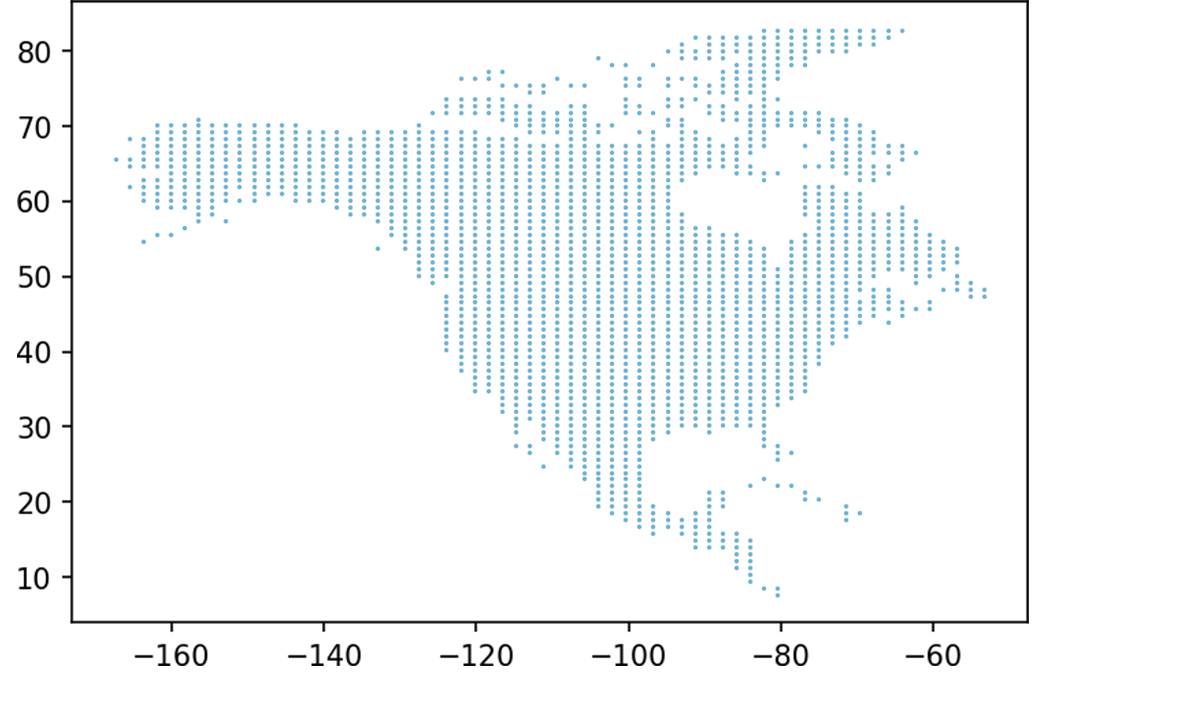
With the model created, the next step was to apply the model across the North American continent to take the input data (annual temperature, rainfall, latitude, longitude, and a specified time) to generate new predictions. To begin, we first generated new points to analyze from our trained model using a uniform distribution of synthetic data over North America.
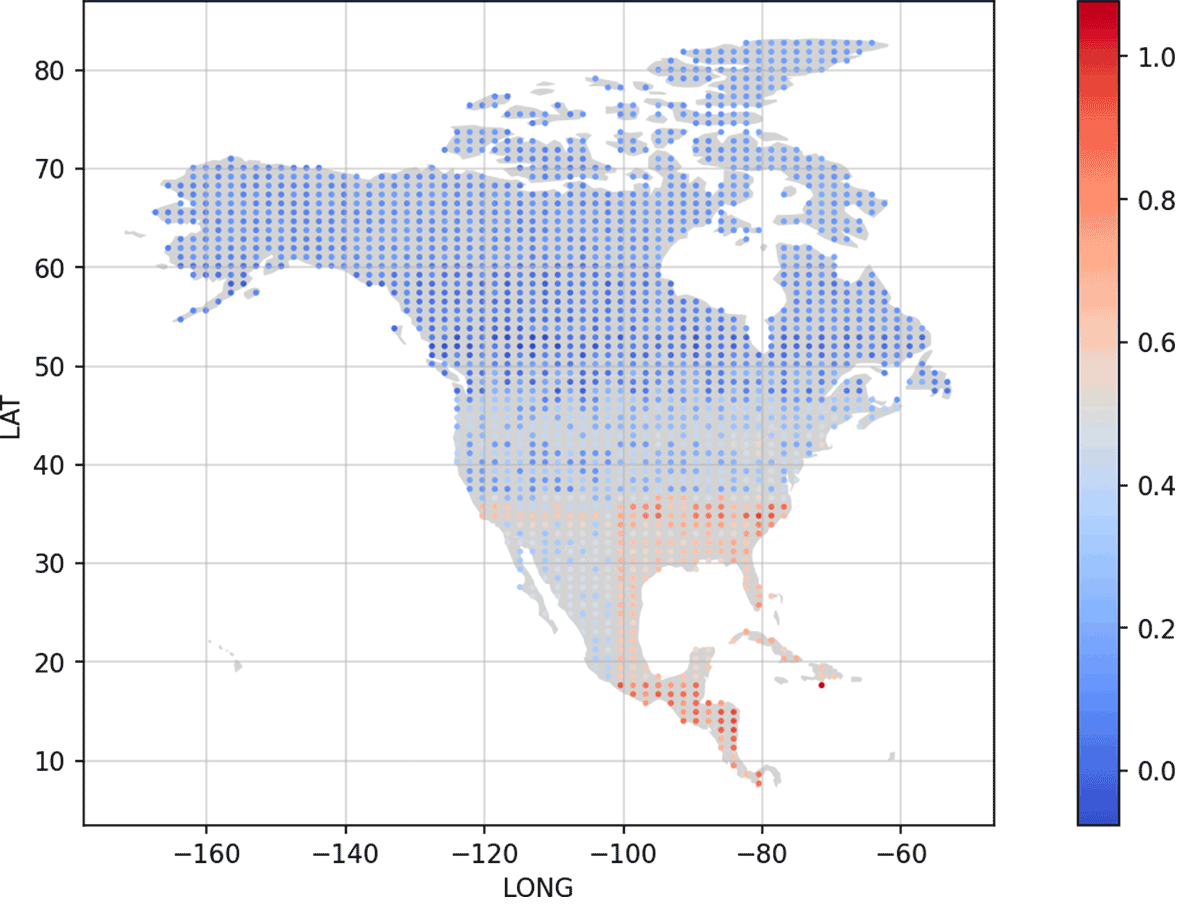
Step 7: Model Inferencing on New Data.
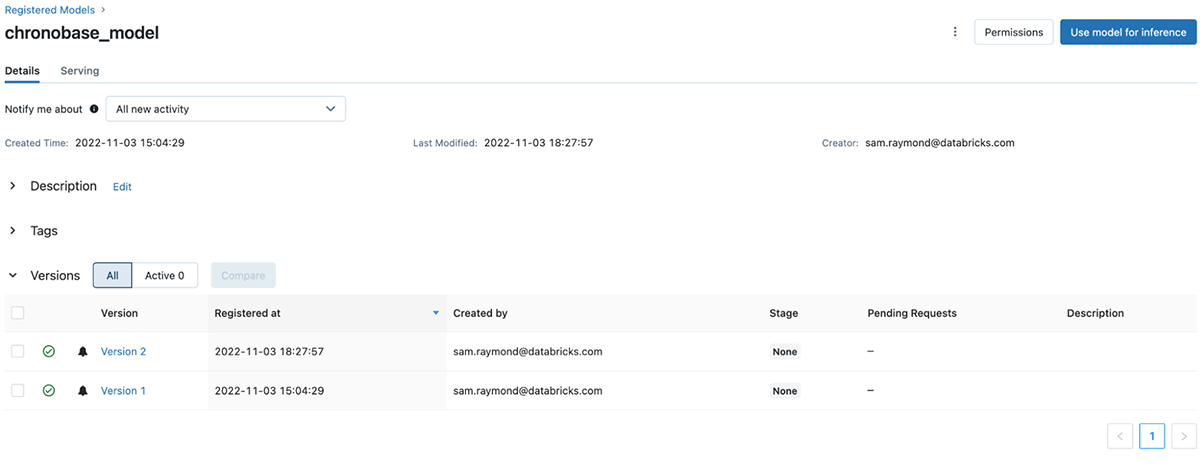
With these new points generated, data was populated for temperatures and rainfall to create predictions with these new values. Databricks offers Managed MLflow to help manage the complete ML lifecycle for any scale data. The results, shown here, indicate that the warmer, wetter regions around the gulf appear to have the strongest relative increase in carbon sequestration if left to naturally absorb and have agricultural processes paused. This current model is used to predict the relative absorption of carbon. This is used to compare different locations, where a rich or poor soil carbon environment can be more equally compared. It is worth noting that to calculate the amount of carbon that could be sequestered would require measurements of the soil carbon in the location of interest. Another important point is to consider that regions that are typically rich in soil carbon are also normally regions where a lot of agriculture takes place. With the competing forces of population/economic growth and removing carbon from the atmosphere, care would need to be taken when selecting areas to allocate for carbon sequestration via this method.
Even with this simple process, a model can be built quickly and easily to take this complex dataset and start to provide useful insights into how to better heal our planet. While the researchers at the Terrer Lab will further improve this model and the data supporting it, the workflow that is possible in the Lakehouse has shown to accelerate the scientific process to enable visualization and model development to better understand the problem and potential solutions. Collaborators can easily be added to this environment as needed or data can be shared across environments using Delta Sharing.
Potential for the Lakehouse to improve climate solutions
The Lakehouse has the potential to improve climate and sustainability solutions by synthesizing data from various sources and making it available for various stakeholder groups to use in developing new models. Features like the Delta Sharing protocol present a powerful tool to aid and enhance data collaboration between stakeholders. This allows for the creation of more accurate and comprehensive models that can provide valuable insights and inform decision making, directly contributing to the fight against climate change.
Individuals and organizations can get involved in this important work by contributing data to the chronobase dataset and using the Lakehouse and Delta platforms to build and deploy machine learning models. By working together, we can use data and AI to help heal the climate and address one of the most pressing challenges of our time.
Getting involved and call to action
Climate data is generally fragmented and heterogeneous, making it difficult to accurately analyze and make predictions.
To improve climate and sustainability solutions, the Lakehouse needs more datasets to build towards a climate data hub, which would allow for the sharing of data using tools like Delta Sharing and accessed with the Unity Catalog. This would enable the creation of more accurate and comprehensive models.
Individuals and organizations can add in new data points from sources such as the AWS catalog, NOAA, and The EU's Copernicus. To get involved in this important work, contribute data to the Lakehouse so we can all use its tools to improve our collective knowledge, build and deploy ML models, and solve these challenges. By working together, we can use data and AI to combat climate change and address one of the most pressing challenges of our time.
Get the latest posts in your inbox
Subscribe to our blog and get the latest posts delivered to your inbox.