Implementing Disaster Recovery for a Databricks Workspace
by Ankit Shah and Lorin Dawson
This post is a continuation of the Disaster Recovery Overview, Strategies, and Assessment and Disaster Recovery Automation and Tooling for a Databricks Workspace.
Disaster Recovery refers to a set of policies, tools, and procedures that enable the recovery or continuation of critical technology infrastructure and systems in the aftermath of a natural or human-caused disaster. Even though Cloud Service Providers such as AWS, Azure, Google Cloud and SaaS companies build safeguards against single points of failure, failures occur. The severity of the disruption and its impact on an organization can differ. For cloud-native workloads, a clear disaster recovery pattern is critical.
Disaster Recovery Setup for Databricks
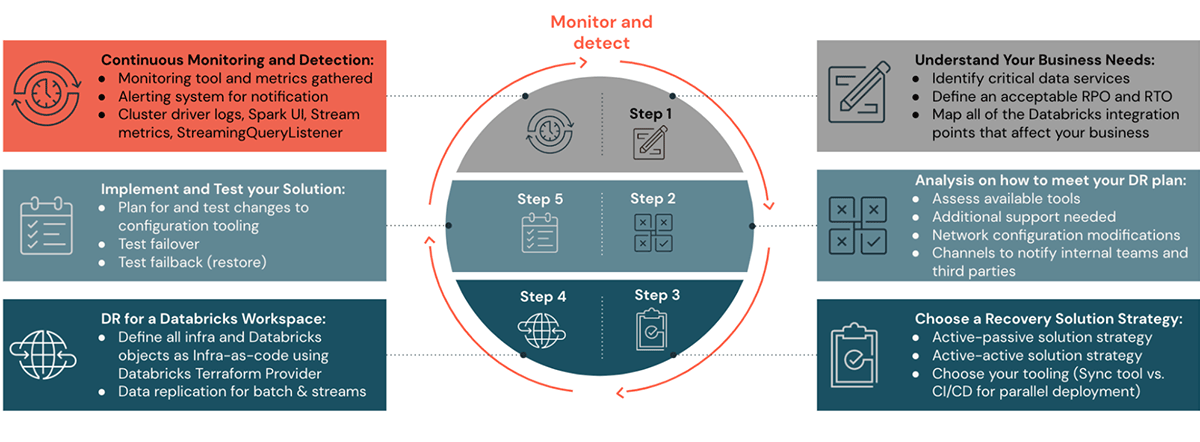
Please see the previous blog posts in this DR blog series to understand steps one through four on how to plan, set up a DR solution strategy, and automate. In steps five and six of this blog post, we will look at how to monitor, execute, and validate a DR setup.
Disaster Recovery Solution
A typical Databricks implementation includes a number of critical assets, such as notebook source code, queries, job configs, and clusters, that must be recovered smoothly to ensure minimal disruption and continued service to the end users.
High-level DR considerations:
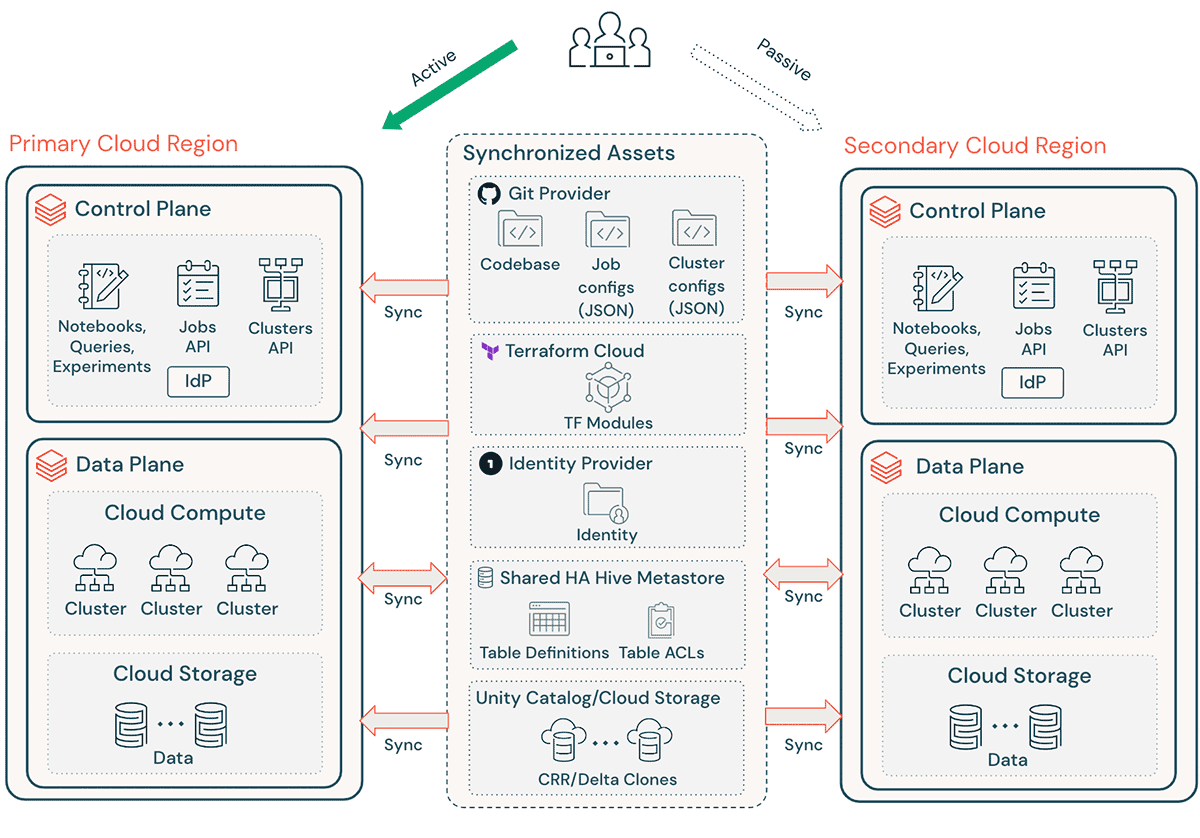
- Ensure your architecture is replicable via Terraform (TF), making it possible to create and recreate this environment elsewhere.
- Use Databricks Repos (AWS | Azure | GCP) to sync Notebooks and application code in supported arbitrary files (AWS | Azure | GCP).
- Use Terraform Cloud to trigger TF runs (plan and apply) for infra and app pipelines while maintaining state
- Replicate data from cloud storage accounts such as Amazon S3, Azure ADLS, and GCS to the DR region. If you are on AWS, you can also store data using S3 Multi-Region Access Points so that the data spans multiple S3 buckets in different AWS Regions.
- Databricks cluster definitions can contain availability zone-specific information. Use the “auto-az” cluster attribute when running Databricks on AWS to avoid any issues during regional failover.
- Manage configuration drift at the DR Region. Ensure that your infrastructure, data, and configuration are as needed in the DR Region.
- For production code and assets, use CI/CD tooling that pushes changes to production systems simultaneously to both regions. For example, when pushing code and assets from staging/development to production, a CI/CD system makes it available in both regions at the same time.
- Use Git to sync TF files and infrastructure code base, job configs, and cluster configs.
- Region-specific configurations will need to be updated prior to running TF `apply` in a secondary region.
Note: Certain services such as Feature Store, MLflow pipelines, ML experiment tracking, Model management, and Model deployment cannot be considered feasible at this time for Disaster Recovery. For Structured Streaming and Delta Live Tables, an active-active deployment is needed to maintain exactly-once guarantees but the pipeline will have eventual consistency between the two regions.
Additional high-level considerations can be found in the previous posts of this series.
Monitoring and Detection
It is crucial to know as early as possible if your workloads are not in a healthy state so you can quickly declare a disaster and recover from an incident. This response time coupled with appropriate information is critical in meeting aggressive recovery objectives. It is critical to factor incident detection, notification, escalation, discovery, and declaration into your planning and objectives to provide realistic, achievable objectives.
Service Status Notifications
The Databricks Status Page provides an overview of all core Databricks services for the control plane. You can easily view the status of a specific service by viewing the status page. Optionally, you can also subscribe to status updates on individual service components, which sends an alert whenever the status you are subscribed to changes.
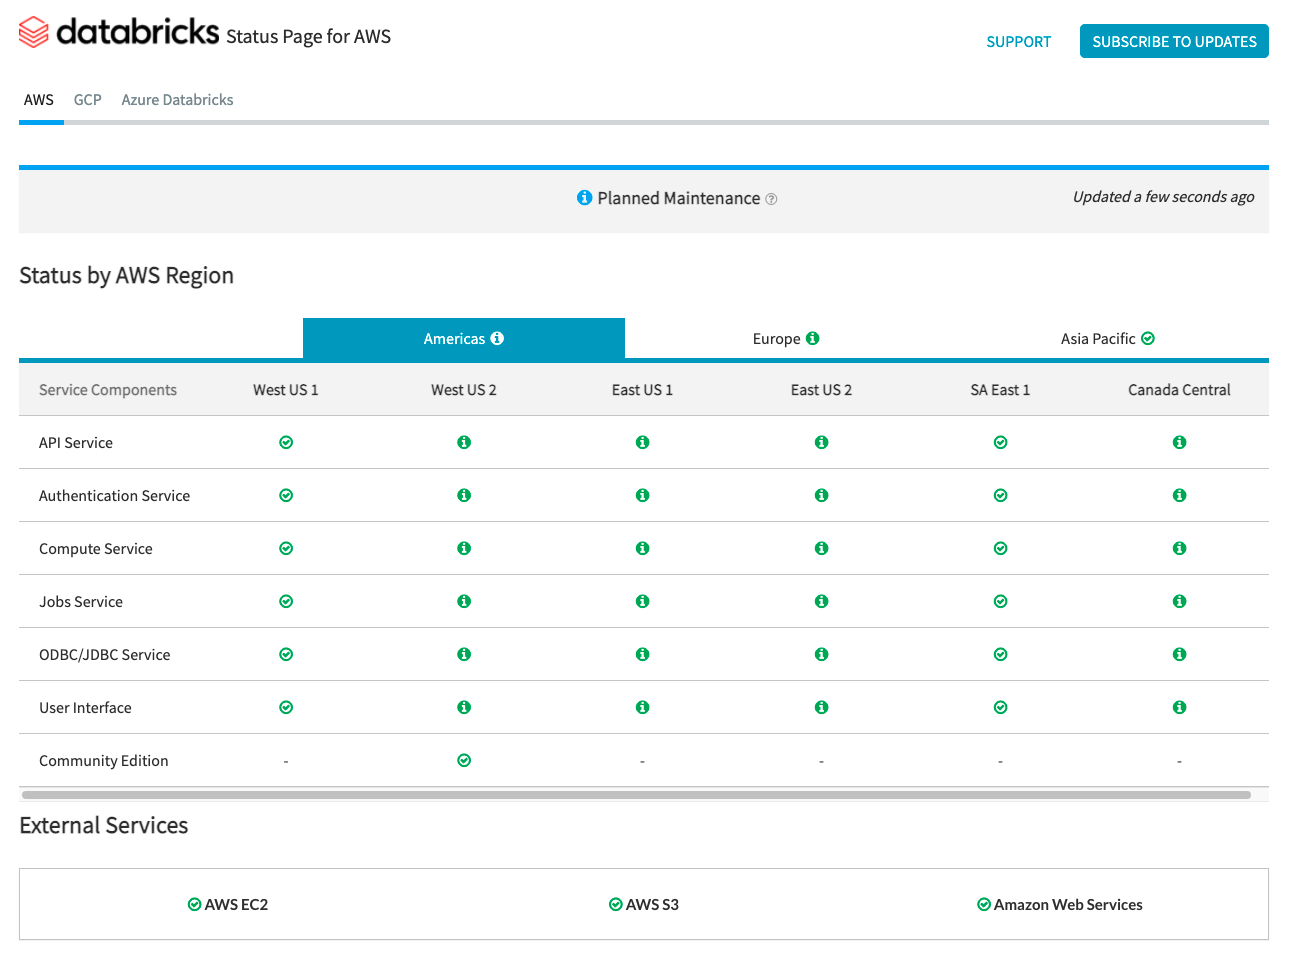
For status checks regarding the data plane, AWS Health Dashboard, Azure Status Page, and GCP Service Health Page should be used for monitoring.
AWS and Azure offer API endpoints that tools can use to ingest and alert on status checks.
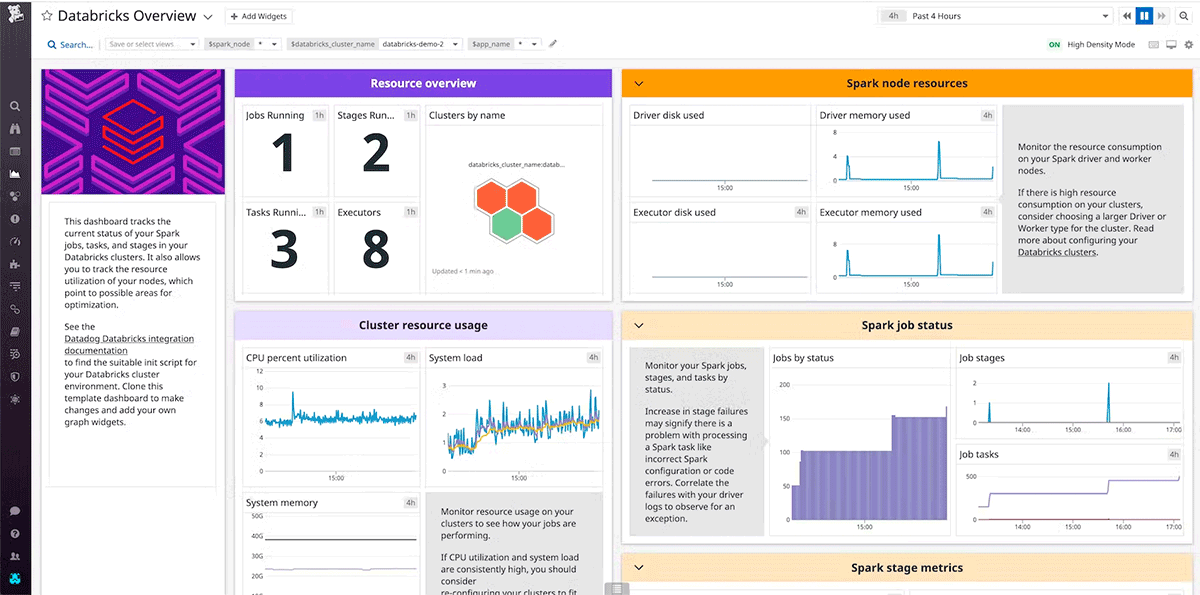
Infrastructure Monitoring and Alerting
Using a tool to collect and analyze data from infrastructure allows teams to track performance over time. This proactively empowers teams to minimize downtime and service degradation overall. In addition, monitoring over time establishes a baseline for peak performance that is needed as a reference for optimizations and alerting.
Within the context of DR, an organization may not be able to wait for alerts from its service providers. Even if RTO/RPO requirements are permissive enough to wait for an alert from the service provider, notifying the vendor’s support team of performance degradation in advance will open an earlier line of communication.
Both DataDog and Dynatrace are popular monitoring tools that provide integrations and agents for AWS, Azure, GCP, and Databricks clusters.
Health Checks
For the most stringent RTO requirements, you can implement automated failover based on health checks of Databricks Services and other services with which the workload directly interfaces in the Data Plane, for example, object stores and VM services from cloud providers.
Design health checks that are representative of user experience and based on Key Performance Indicators. Shallow heartbeat checks can assess if the system is operating, i.e. if the cluster is running. While deep health checks, such as system metrics from individual nodes’ CPU, disk usage, and Spark metrics across each active stage or cached partition, go beyond shallow heartbeat checks to determine significant degradation in performance. Use deep health checks based on multiple signals according to functionality and baseline performance of the workload.
Exercise caution if fully automating the decision to failover using health checks. If false positives occur or an alarm is triggered, but the business can absorb the impact, there is no need to failover. A false failover introduces availability risks, and data corruption risks, and is an expensive operation time-wise. It is recommended to have a human-in-loop, such as an on-call incident manager, to make the decision if an alarm is triggered. An unnecessary failover can be catastrophic, and the additional review helps determine if the failover is required.
Executing a DR Solution
Two execution scenarios exist at a high level for a Disaster Recovery solution. In the first scenario, the DR site is considered temporary. Once service is restored at the primary site, the solution must orchestrate a failover from the DR site to the permanent, primary site. Limiting the creation of new artifacts while the DR site is active should be discouraged since it is temporary and complicates failback in this scenario. Conversely in the second scenario, the DR site will be promoted to the new primary, allowing users to resume work faster since they do not need to wait for services to be restored. Furthermore, this scenario requires no failback, but the former primary site must be prepared as the new DR site.
In either scenario, each region within the scope of the DR solution should support all the required services, and a process that validates the target workspace is in good operating condition must exist as a safeguard. The validation may include simulated authentication, automated queries, API Calls, and ACL checks.
Failover
When triggering a failover to the DR site, the solution cannot assume the ability to shut down the system gracefully is possible. The solution should attempt to shut down running services in the primary site, record the shutdown status for each service, then continue attempting to shut down services without the appropriate status at a defined time interval. This reduces the risk that data is processed simultaneously in both the primary and DR sites minimizing data corruption and facilitating the failback process once services are restored.
High-level steps to activate the DR site include:
- Run a shutdown process on the primary site to disable pools, clusters, and scheduled jobs on the primary region so that if the failed service returns online, the primary region does not start processing new data.
- Confirm that the DR site infrastructure and configurations are up to date.
- Check the date of the latest synced data. See Disaster recovery industry terminology. The details of this step vary based on how you synchronize data and unique business needs.
- Stabilize your data sources and ensure that they are all available. Include all critical external data sources, such as object storage, databases, pub/sub systems, etc.
- Inform platform users.
- Start relevant pools (or increase the min_idle_instances to relevant numbers).
- Start relevant clusters, jobs, and SQL Warehouses (if not terminated).
- Change the concurrent run for jobs and run relevant jobs. These could be one-time runs or periodic runs.
- Activate job schedules.
- For any outside tool that uses a URL or domain name for your Databricks workspace, update configurations to account for the new control plane. For example, update URLs for REST APIs and JDBC/ODBC connections. The Databricks web application’s customer-facing URL changes when the control plane changes, so notify your organization’s users of the new URL.
Failback
Returning to the Primary site during Failback is easier to control and can be done in a maintenance window. Failback will follow a very similar plan to Failover, with four major exceptions:
- The target region will be the primary region.
- Since Failback is a controlled process, the shutdown is a one-time activity that does not require status checks to shutdown services as they come back online.
- The DR site will need to be reset as needed for any future failovers.
- Any lessons learned should be incorporated into the DR solution and tested for future disaster events.
Conclusion
Test your disaster recovery setup on a regular basis under real-world conditions to ensure it works properly. There's little point in keeping a disaster recovery solution that can't be used when it's needed. Some organizations test their DR infrastructure by performing failover and failback between regions every few months. On a regular basis, failover to the DR site tests your assumptions and processes to ensure that they meet recovery requirements in terms of RPO and RTO. This also ensures that your organization's emergency policies and procedures are up to date. Test any organizational changes that are required to your processes and configurations in general. Your disaster recovery plan has an impact on your deployment pipeline, so make sure your team is aware of what needs to be kept in sync.
Get the latest posts in your inbox
Subscribe to our blog and get the latest posts delivered to your inbox.