Architecting a High-Concurrency, Low-Latency Data Warehouse on Databricks That Scales
Unlock cost-efficient performance at scale: practical insights to build a modern data warehouse on Databricks
by Ben Dunmire, Dan Lueck and Jen Lim
- Unify warehousing, analytics and AI with Databricks—AI handles the optimizations for best price/performance.
- Tune architecture to your scale, performance and cost goals to maximize impact.
- Deliver sub-second, production-grade warehousing that grows with your business.
Implementing Production-Grade Analytics on a Databricks Data Warehouse
High-concurrency, low-latency data warehousing is essential for organizations where data drives critical business decisions. This means supporting hundreds of concurrent users, delivering rapid query performance for interactive analytics and enabling real‑time insights for fast, informed decision‑making. A production‑grade data warehouse is more than a support system—it is a catalyst for growth and innovation.
Databricks pioneered the lakehouse architecture to unify data, analytics and AI workloads—eliminating costly data duplication and complex system integrations. With built-in autonomous performance optimizations, the lakehouse delivers competitive price/performance while simplifying operations. As an open lakehouse, it also ensures fast, secure access to critical data through Databricks SQL, powering BI, analytics and AI tools with unified security and governance that extend across the entire ecosystem. Open interoperability is essential since most users interact with the warehouse through these external tools. The platform scales effortlessly—not only with data and users, but also with the growing diversity of tools your teams rely on—and offers powerful built-in capabilities like Databricks AI/BI, Databricks and more, while maintaining flexibility and interoperability with your existing ecosystem.
This blog provides a comprehensive guide for organizations at any stage of their lakehouse architecture journey—from initial design to mid-implementation to ongoing optimization—on maximizing high-concurrency, low-latency performance with the Databricks Data Intelligence Platform. We will explore:
- Core architectural components of a data warehouse and their collective impact on platform performance.
- A structured performance-tuning framework to guide the optimization of these architectural elements.
- Best practices, monitoring strategies and tuning methodologies to ensure sustained performance at scale.
- A real-world case study demonstrating how these principles work together in practice.
Key Architectural Considerations
While many foundational principles of traditional data warehouses still apply—such as sound data modeling, robust data management and embedded data quality—designing a modern lakehouse for production‑grade analytics requires a more holistic approach. Central to this is a unified governance framework, and Unity Catalog (AWS | Azure | GCP) plays a critical role in delivering it. By standardizing access controls, lineage tracking and auditability across all data and AI assets, Unity Catalog ensures consistent governance at scale—something that's increasingly essential as organizations grow in data volume, user concurrency and platform complexity.
Effective design requires:
- Adoption of proven architectural best practices
- An understanding of tradeoffs between interconnected components
- Clear objectives for concurrency, latency and scale based on business requirements
In a lakehouse, performance outcomes are influenced by architectural choices made early in the design phase. These deliberate design decisions highlight how modern lakehouses represent a fundamental departure from legacy data warehouses across five critical axes:

With these architectural considerations in mind, let's explore a practical framework for implementing a production-grade data warehouse that can deliver on the promise of high-concurrency and low-latency at scale.
Technical Solution Breakdown
The following framework distills best practices and architectural principles developed through real-world engagements with enterprise customers. Whether you're building a new data warehouse, migrating from a legacy platform or tuning an existing lakehouse, these guidelines will help you accelerate time to production while delivering scalable, performant and cost-efficient outcomes.
Start With a Use Case-Driven Assessment
Before implementing, we recommend a rapid assessment of a critical workload—often your slowest dashboard or most resource-intensive pipeline. This approach helps you identify performance gaps and prioritize areas for optimization.
Ask the following questions to frame your analysis:
- What performance metrics matter most (e.g., query latency, throughput, concurrency) and how do they compare to business expectations?
- Who uses this workload, when and how frequently?
- Are compute costs proportional to the workload's business value?
This assessment creates a foundation for targeted improvements and helps align your optimization efforts with business impact.
Implementation Framework
The framework below outlines a step-by-step approach to implementing or modernizing your warehouse on Databricks:
- Assess the Current State and Prioritize Your Goals
- Evaluate and compare the existing architecture against performance, cost and scalability targets.
- Define business (and technology) requirements for concurrency, latency, scale, cost, SLAs and other factors so the goal posts don't keep moving.
- Identify gaps that impact the business most and prioritize remediation based on value and complexity (whether designing new, mid-migration or in production).
- Define Warehouse Architecture and Governance
- Design logical segmentation: Determine which teams or use cases will share or require dedicated SQL Warehouses.
- Right-size your warehouse instances, apply tagging and define defaults (e.g., cache settings, timeouts, etc.).
- Understand and plan for fine-grained configurations like default caching, warehouse timeouts, JDBC timeouts from BI tools and SQL configuration parameters (AWS | Azure | GPC).
- Establish a governance model for warehouses covering administrator (AWS | Azure | GCP) and end user (AWS | Azure | GCP) roles and responsibilities.
- Invest in training and provide implementation templates to ensure consistency across teams.
- Enable Observability
- Enable observability and monitoring for SQL warehouse usage to detect anomalies, uncover inefficient workloads and optimize resource utilization.
- Activate out-of-the-box functionality (AWS | Azure | GCP) alongside custom telemetry and automate alerts/remediations where possible.
- Learn to leverage system tables, warehouse monitoring and query profiles to identify issues like spill, shuffle or queuing.
- Integrate cost data and lineage metadata (e.g., BI tool context via query history tables) to correlate performance and spend.
- Implement Optimizations and Best Practices
- Leverage insights from observability to align workload performance with business and technology requirements.
- Implement AI features for cost, layout and compute efficiency.
- Codify learnings into reusable templates, documentation and checklists to scale best practices across teams.
- Optimize incrementally using an effort (complexity, timeline, expertise) vs. impact (performance, cost, maintenance overhead) matrix to prioritize.
In the sections below, let's walk through each stage of this framework to understand how thoughtful design and execution enable high concurrency, low latency and business-aligned cost performance on Databricks.
Assess the Current State and Prioritize Your Goals
Before diving into best practices and tuning techniques, it's essential to understand the foundational levers that shape lakehouse performance—such as compute sizing, data layout and data modeling. These are the areas teams can directly influence to meet high-concurrency, low-latency, scale goals.
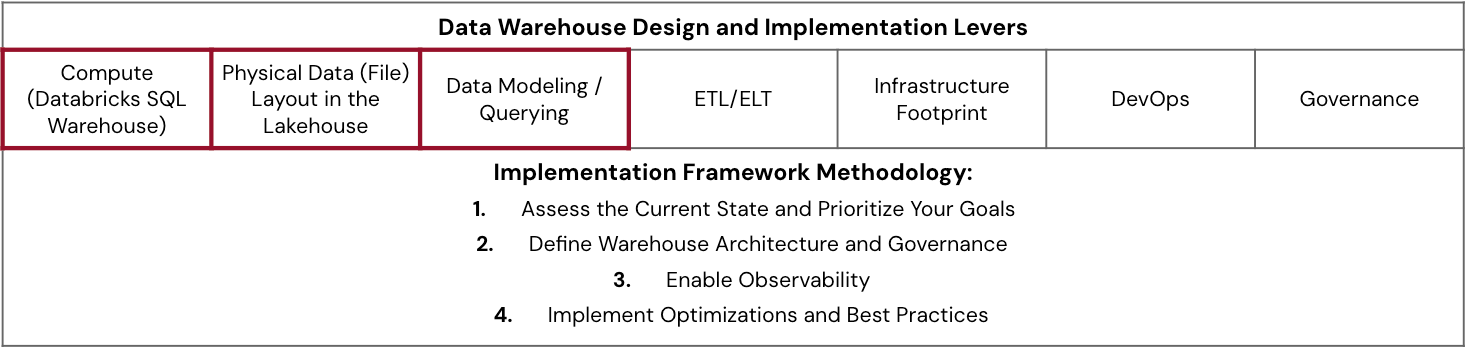
The scorecard below provides a simple matrix to assess maturity across each lever and identify where to focus your efforts. To use it, evaluate each lever across three dimensions: how well it meets business needs, how closely it aligns with best practices, the level of technical capability your team has in that area and governance. Apply a Red-Amber-Green (RAG) rating to each intersection to quickly visualize strengths (green), areas for improvement (amber) and critical gaps (red). The best practices and evaluation techniques later in this blog will inform the rating–use this directionality in combination with a more granular maturity assessment. This exercise can guide discussions across teams, surface hidden bottlenecks and help prioritize where to invest—whether in training, architecture changes or automation.
With the components that drive lakehouse performance and a framework to implement them defined, what's next? The combination of best practices (what to do), tuning techniques (how to do it) and assessment methods (when to do it) provides the actions to take to achieve your performance objectives.
The focus will be on specific best practices and granular configuration techniques for a few critical components that work harmoniously to operate a high-performing data warehouse.
Define Warehouse Architecture and Governance
Compute (Databricks SQL Warehouse)
While compute is often seen as the primary performance lever, compute sizing decisions should always be considered alongside data layout design and modeling/querying, as these directly impact the compute needed to achieve the required performance.
Right-sizing SQL warehouses is critical for cost-effective scaling. There's no crystal ball for precise sizing upfront, but these are a selection of key heuristics to follow for organizing and sizing SQL warehouse compute.
- Enable SQL Serverless Warehouses: They offer instantaneous compute, elastic autoscaling and are fully managed, simplifying operations for all types of uses, including bursty and inconsistent BI/analytics workloads. Databricks fully manages the infrastructure, with that infrastructure cost baked in, offering the potential for TCO reductions.
- Understand Workloads and Users: Segment users (human/automated) and their query patterns (interactive BI, ad hoc, scheduled reports) to use different warehouses scoped by application context, a logical grouping by purpose, team, function, etc. Implement a multi-warehouse architecture, by these segments, to have more fine-grained sizing control and the ability to monitor independently. Ensure tags for cost attribution are enforced. Reach out to your Databricks account contact to access upcoming features intended to prevent noisy neighbors.
- Iterative Sizing and Scaling: Don't overthink the initial warehouse size or min/max cluster settings. Adjustments based on monitoring real workload performance, using mechanisms in the next section, are far more effective than upfront guesses. Data volumes and the number of users do not accurately estimate the compute needed. The types of queries, patterns and concurrency of query load are better metrics, and there's an automated benefit from Intelligent Workload Management (IWM) (AWS | Azure | GCP).
- Understand When to Resize vs. Scale: Increase warehouse size ("T-shirt size") when needing to accommodate resource-heavy, complex queries like large aggregations and multi-table joins, which require high memory—monitor frequency of disk spills and memory utilization. Increase the number of clusters for autoscaling when dealing with bursty concurrent usage and when you see persistent queuing as a result of many queries waiting to execute, not a few intensive queries pending.
- Balance Availability and Cost: Configure auto-stop settings. Serverless's rapid cold start makes auto-stopping a significant cost-saver for idle periods.
Physical Data (File) Layout in the Lakehouse
Fast queries begin with data skipping, where the query engine reads only relevant files using metadata and statistics for efficient file pruning. The physical organization of your data directly impacts this pruning, making file layout optimization critical for high-concurrency, low-latency performance.
The evolution of data layout techniques on Databricks offers various approaches for optimal file organization:
For new tables, Databricks recommends defaulting to managed tables with Auto Liquid Clustering (AWS | Azure | GCP) and Predictive Optimization (AWS | Azure | GCP). Auto Liquid Clustering intelligently organizes data based on query patterns, and you can specify initial clustering columns as hints to enable it in a single command. Predictive Optimization automatically handles maintenance jobs like OPTIMIZE, VACUUM and ANALYZE.
For existing deployments using external tables, consider migrating to managed tables to fully leverage these AI-powered features, prioritizing high-read and latency-sensitive tables first. Databricks provides an automated solution (AWS | Azure | GCP) with the ALTER TABLE...SET MANAGED command to simplify the migration process. Additionally, Databricks supports managed Iceberg tables as part of its open table format strategy.
Data Modeling / Querying
Modeling is where business requirements meet data structure. Always start by understanding your end consumption patterns, then model to those business needs using your organization's preferred methodology—Kimball, Inmon, Data Vault or denormalized approaches. The lakehouse architecture on Databricks supports them all.
Unity Catalog features extend beyond observability and discovery with lineage, primary keys (PKs), constraints and schema evolution capabilities. They provide crucial hints to the Databricks query optimizer, enabling more efficient query plans and improving query performance. For instance, declaring PKs and foreign keys with RELY allows the optimizer to eliminate redundant joins, directly impacting speed. Unity Catalog's robust support for schema evolution also ensures agility as your data models adapt over time. Unity Catalog provides a standard governance model based on ANSI SQL.
Additional relevant resources include Data Warehousing Modeling Techniques and a three-part series on Dimensional Data Warehousing (Part 1, Part 2 and Part 3).
Enable Observability
Activating monitoring and action tuning decisions perfectly highlights the interconnectedness of data warehouse components amongst compute, physical file layout, query efficiency and more.
- Start by establishing observability through dashboards and applications.
- Define learned patterns for identifying and diagnosing performance bottlenecks and then correcting them.
- Iteratively build in automation through alerting and agentic corrective actions.
- Compile common trends causing bottlenecks and incorporate them into development best practices, code review checks and templates.
Continuous monitoring is essential for sustained high, consistent performance and cost efficiency in production. Understanding standard patterns allows one to refine one's tuning decisions as usage evolves.
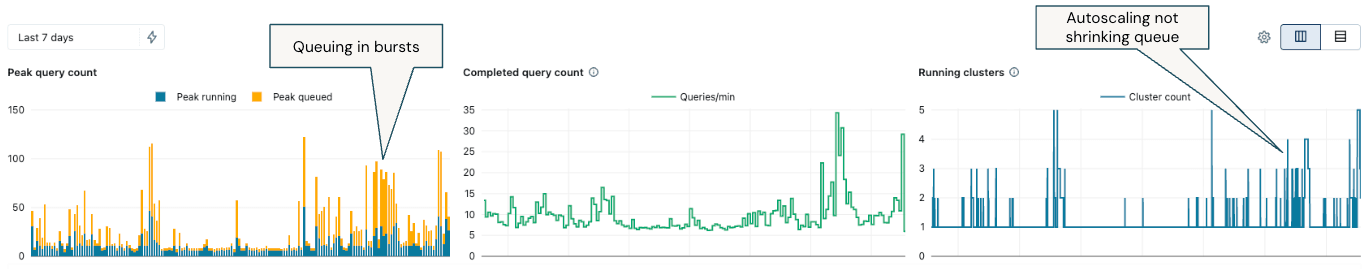
Monitor and Adjust: Use each warehouse's built-in Monitoring tab (AWS | Azure | GCP) for real-time insights into peak concurrent queries, utilization and other key statistics. This provides a quick reference for observation, but should be supplemented with further techniques to drive alerts and action.
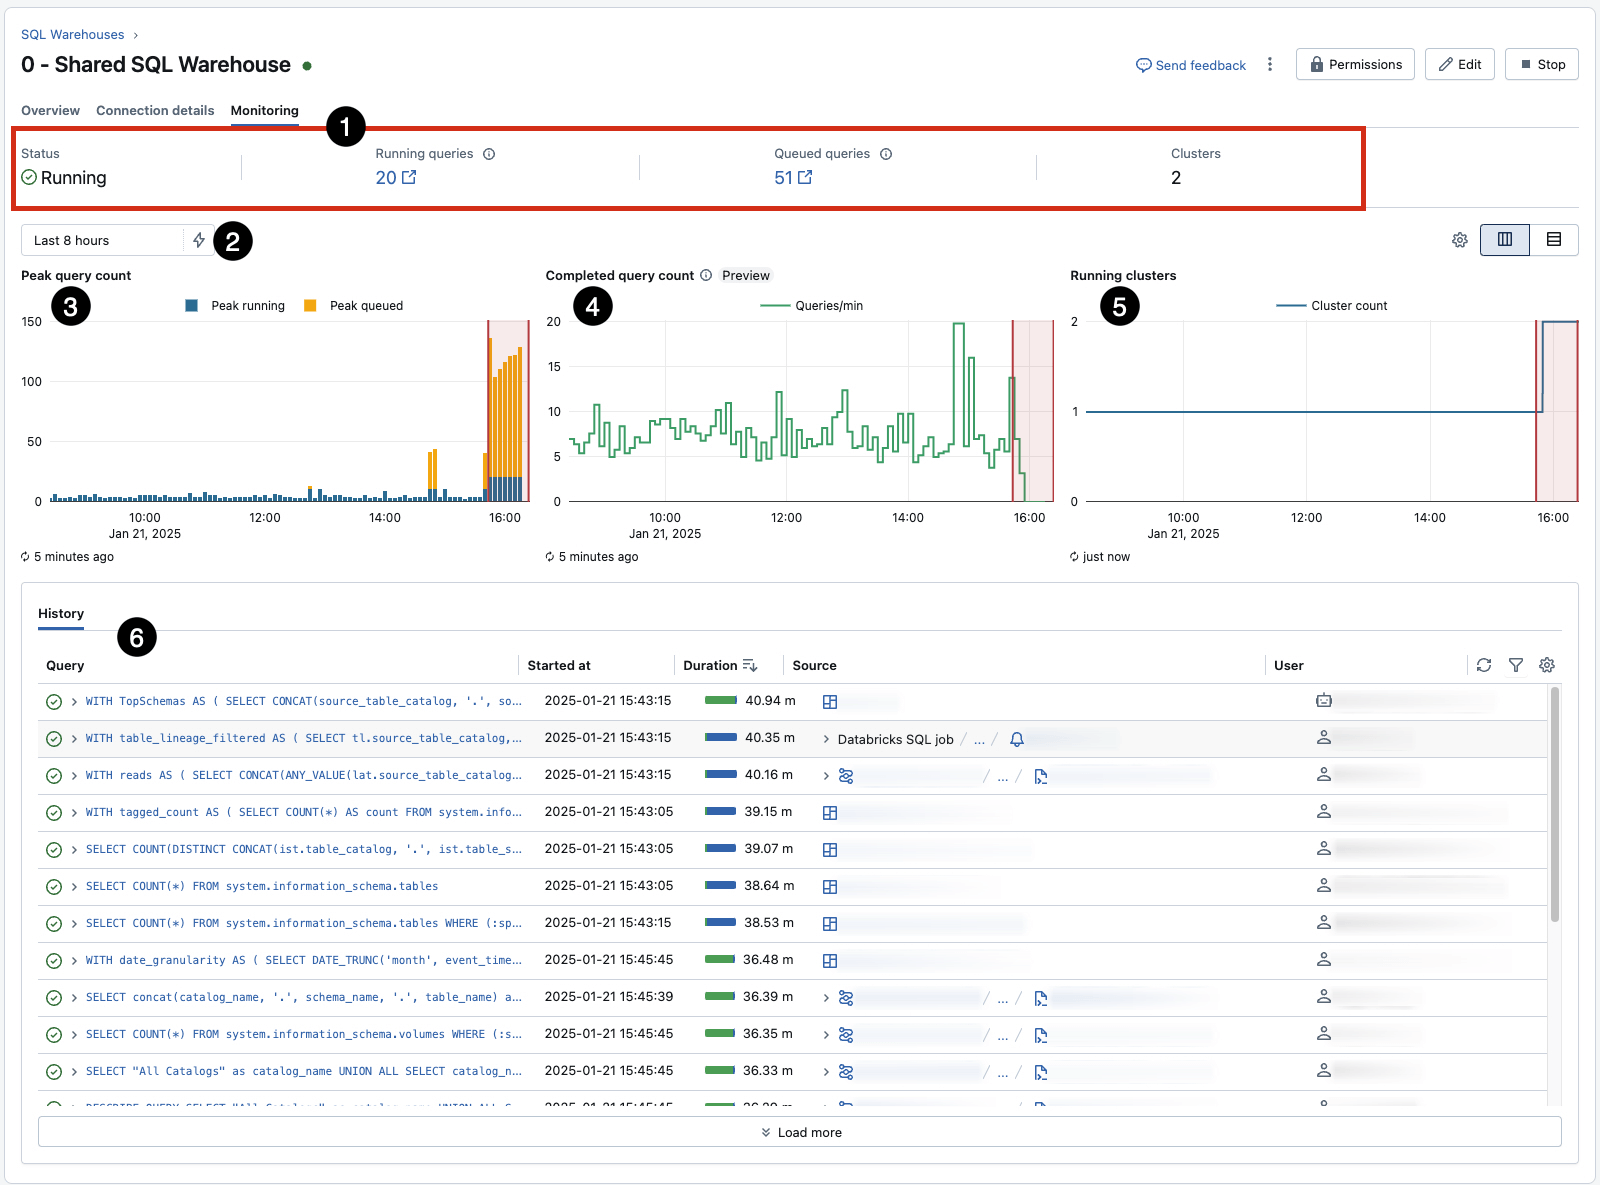
- Pay particular attention to 3, which reveals queueing due to concurrency limits for a given warehouse (and can be influenced by resizing) and 5, which shows autoscaling events in response to the queue. 6 captures query history, a great starting point for identifying and investigating long-running and inefficient workloads.
Leverage system tables: Supports more granular, bespoke monitoring. Over time, develop custom dashboards and alerts, but take advantage of prepared offerings:
- The Granular SQL Warehouse Monitoring Dashboard provides a comprehensive view of informed scaling decisions by understanding who and what drives costs.
- The DBSQL Workflow Advisor provides a view across scaling, query performance to identify bottlenecks and cost attribution.
- Introduce custom SQL Alerts (AWS | Azure | GCP) for in-built notifications learned from the monitoring events from the above.
For customers interested in cost attribution and observability beyond just the SQL Warehouse, this dedicated blog, From Chaos to Control: A Cost Maturity Journey with Databricks, on the cost maturity journey, is a valuable resource.
Utilize Query Profiles: The Query Profile (AWS | Azure | GCP) tool is your primary diagnostic for individual query performance issues. It provides detailed execution plans and helps pinpoint bottlenecks that affect required compute.
 |
|

A few starting point suggestions of what to look for from the query profile:
- Check if pruning occurs. If there should be pruning (AWS | Azure | GCP) (i.e., reducing data read from storage using metadata/statistics of tables), which you'd expect if applying predicates or joins, but it's not occurring, then analyze the file layout strategy. Ideally, files/partitions read should be low and files pruned should be high.
- A significant amount of wall-clock time spent in "Scheduling" (greater than a few seconds) suggests queuing.
- If the 'Result fetching by client' duration takes most of the time, it indicates a potential network issue between the external tool/application and SQL warehouse.
- Bytes read from the cache will vary depending on usage patterns, as users running queries using the same tables on the same warehouse will naturally leverage the cached data rather than re-scanning files.
- The DAG (Directed Acyclic Graph–AWS | Azure | GCP) allows you to identify steps by amount of time they took, memory utilized and rows read. This can help narrow down performance issues for highly complex queries.
- To detect the small file problem (where data files are significantly smaller than the optimal size, causing inefficient processing), ideally, the average file size should be between 128MB and 1GB, depending on the size of the table:
- The majority of the query plan spent scanning source table(s).
- Run
DESCRIBE DETAIL [Table Name]. To find the average file size, divide thesizeInBytesby thenumFiles. Or, in the query profile, use [Bytes read] / [Files read].
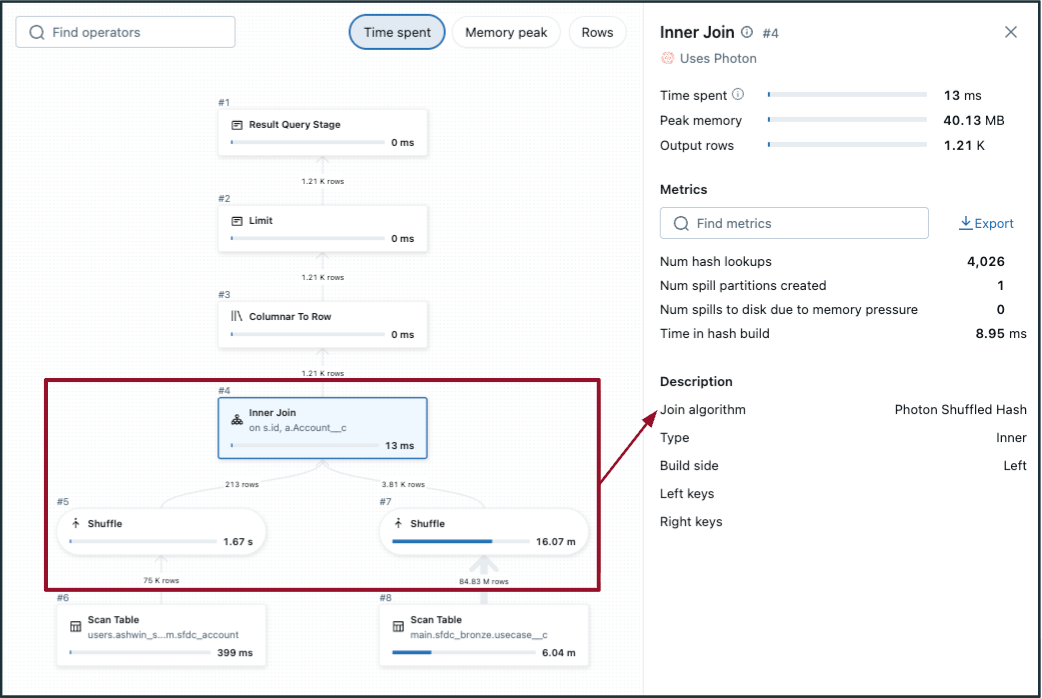
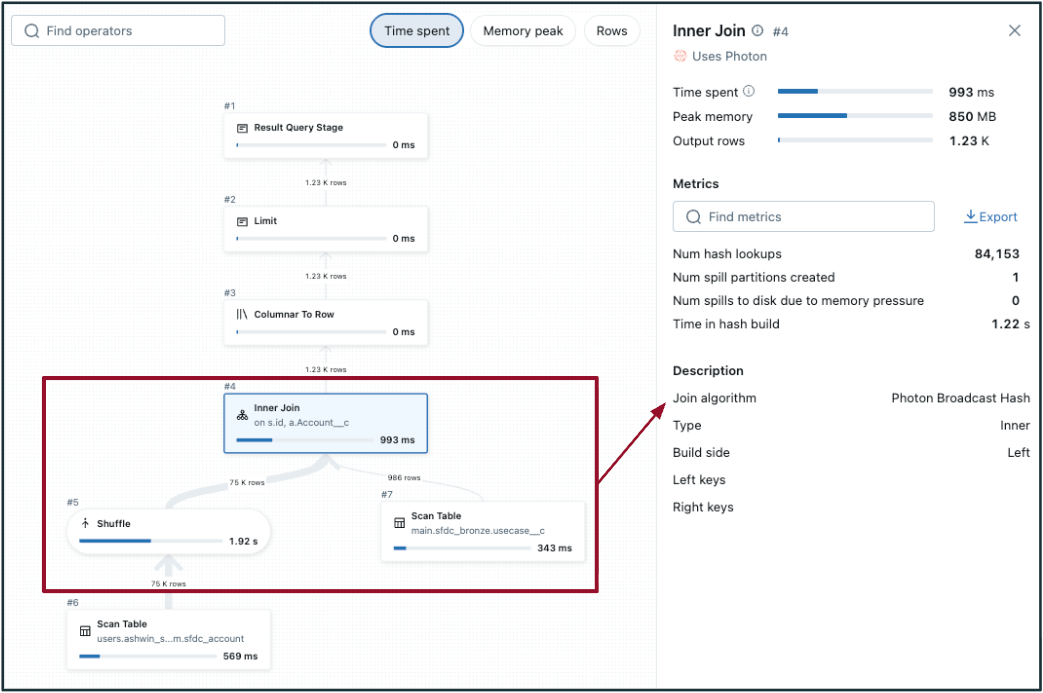
- To detect a potentially inefficient shuffle hash join:
- Choose the join step in the DAG and check the "Join algorithm".
- No/low file pruning.
- In the DAG, shuffle occurs on both tables (on either side of the join, like in the image to the left). If one of the tables is small enough, consider broadcasting to perform a broadcast hash join instead (shown in the image to the right).
- Adaptive query execution (AQE) defaults to <=30 MB data size for broadcast joins — generally, tables with data size less than 200 MB are good candidates to evaluate for broadcasting. 1 GB is the hard limit.
- Always ensure filters are being applied to reduce source datasets.
 |  |
Implement Optimizations and Best Practices
Performance Issues: The 4 S's + Queuing
Whether configuring compute for a new workload or optimizing, it's necessary to understand the most common performance issues. These fit into a common moniker, "The 4 S's", with a fifth (queuing) added on:
To reduce query latency in your SQL warehouse, determine whether spill, queuing and/or shuffle (skew and small files will come up later) is the primary performance bottleneck. This comprehensive guide provides more details. After identifying the root cause, apply the guidelines below to adjust SQL warehouse sizing accordingly and measure the impact.
- Disk Spill (from memory to disk): Spill occurs when a SQL warehouse runs out of memory and writes temporary results to disk, significantly slower than in-memory processing. In a Query Profile, any amounts against "spill (bytes)" or "spill time" indicate this is occurring.
To mitigate spills, increase the SQL warehouse T-shirt size to provide more memory. Query memory usage can also be reduced through query optimization techniques such as early filtering, reducing skew and simplifying joins. Improving file layout—using appropriately sized files or applying Liquid Clustering—can further limit the amount of data scanned and shuffled during execution.
Helper query on system tables that can be converted to a SQL Alert or AI/BI Dashboard
- Query Queuing: If the SQL Warehouse Monitoring screen shows persistent queuing (where peak queued queries are >10) that doesn't immediately resolve with an autoscaling event, increase the max scaling value for your warehouse. Queuing directly adds latency as queries wait for available resources.
Helper query on system tables that can be converted to a SQL Alert or AI/BI Dashboard
- High Parallelization/Low Shuffle: For queries that can be split into many independent tasks—such as filters or aggregations across large datasets—and show low shuffle in Query Profiles, increasing the SQL warehouse T-shirt size can improve throughput and reduce queuing. Low shuffle indicates minimal data movement between nodes, which enables more efficient parallel execution.
- Narrow transformations (e.g., point lookups, aggregate lookups) generally benefit from more scaling for concurrent query handling. Wide transformations (complex joins with aggregation) generally benefit more from larger warehouse sizes versus scaling.
- High Shuffle: Conversely, when shuffle is high, large amounts of data are exchanged between nodes during query execution—often due to joins, aggregations or poorly organized data. This can be a significant performance bottleneck. In Query Profiles, high shuffle is indicated by large values under "shuffle bytes written", "shuffle bytes read" or long durations in shuffle-related stages. If these metrics are consistently elevated, optimizing the query or improving physical data layout rather than simply scaling up compute is best.
Helper query on system tables that can be converted to a SQL Alert or AI/BI Dashboard
Taking a Macro Monitoring View
While these analyses and rules help understand how queries impact the warehouse at the micro level, sizing decisions are made at the macro level. Generally, start by enabling the monitoring capabilities in the previous section (and customize them) to identify what is happening and then establish threshold measures for spill, skew, queuing, etc., to serve as indicators for when resizing is needed. Evaluate these thresholds to generate an impact score by the frequency with which the thresholds are met or the percentage of time the thresholds are exceeded during regular operation. To share a few example measures (define these using your specific business requirements and SLAs):
- Percentage of time each day that peak queued queries > 10
- Queries that are in the top 5% of highest shuffle for an extended period or consistently in the top 5% highest shuffle during peak usage
- Periods where at least 20% of queries spill to disk or queries that spill to disk on more than 25% of their executions
It's necessary to ground this in recognizing there are tradeoffs to consider, not a single recipe to follow or one-size-fits-all for every data warehouse. If queue latency is not a concern, potentially for overnight queries that refresh, then don't tune for ultra-low-concurrency and recognize cost efficiency with higher latency. This blog provides a guide on best practices and methodologies to diagnose and tune your data warehouse based on your unique implementation needs.
Optimizing Physical Data (File) Layout in the Lakehouse
Below are several best practices for managing and optimizing physical data files stored in your lakehouse. Use these and monitoring techniques to diagnose and resolve issues impacting your data warehouse analytic workloads.
- Adjust the data skipping of a table (AWS | Azure | GCP) if necessary. Delta tables store min/max and other statistics metadata for the first 32 columns by default. Increasing this number can increase DML operation execution times, but may decrease query runtime if the additional columns are filtered in queries.
- To identify if you have the small file problem, review table properties (numFiles, sizeInBytes, clusteringColumns, partitionColumns) and use either Predictive Optimization with Liquid Clustering or ensure you run OPTIMIZE compaction routines on top of properly organized data.
- While the recommendation is to enable Auto Liquid Clustering and take advantage of Predictive Optimization to remove manual tuning, it is helpful to understand underlying best practices and be empowered to tune in select instances manually. Below are useful rules of thumb for selecting clustering columns:
- Start with a single column, the one most naturally used as a predicate (and using the suggestions below), unless there are a few obvious candidates. Often, only huge tables benefit from >1 cluster key.
- Prioritizing columns to use prioritizes optimizing reads over writes. They should be 1) used as filter predicates, 2) used in GROUP BY or JOIN operations and 3) MERGE columns.
- Generally, it should have high cardinality (but not unique). Avoid meaningless values like UUID strings unless you require quick lookups on those columns.
- Don't reduce cardinality (e.g., convert from timestamp to date) as you would when setting a partition column.
- Don't use two related columns (e.g., timestamp and datestamp)—always choose the one with the higher cardinality.
- The order of keys in the CREATE TABLE syntax does not matter. Multi-dimensional clustering is used.
Bringing it All Together: A Systematic Approach
This blog focuses on the first three architectural levers. Other critical implementation components contribute to architecting a high-concurrency, scalable, low-latency data warehouse, including ETL/ELT, infrastructure footprint, DevOps and Governance. Additional product perspective on implementing a lakehouse can be found here, and an array of best practices is available from the Comprehensive Guide to Optimize Databricks, Spark and Delta Lake Workloads.
The foundational components of your data warehouse—compute, data layout and modeling/querying—are highly interdependent. Addressing performance effectively requires an iterative process: continuously monitoring, optimizing and ensuring new workloads adhere to an optimized blueprint. And evolve that blueprint as technology best practices change and your business requirements change. You want the tools and know-how to tune your warehouse to meet your precise concurrency, latency and scalability requirements. Robust governance, transparency, monitoring and security enable this core architectural framework. These are not separate considerations but the bedrock for delivering best-in-class data warehouse experiences on Databricks.
Now, let's explore a recent customer example in which the framework and foundational best practices, tuning and monitoring levers, were applied in practice, and an organization significantly improved its data warehouse performance and efficiency.
Real-World Scenarios and Tradeoffs
Email Marketing Platform Optimization
Business Context
An email marketing platform provides e-commerce retailers with tools to create personalized customer journeys based on rich customer data. The application enables users to orchestrate email campaigns to targeted audiences, helping clients craft segmentation strategies and track performance. Real-time analytics are critical to their business—customers expect immediate visibility into campaign performance metrics like click-through rates, bounces and engagement data.
Initial Challenge
The platform was experiencing performance and cost issues with its analytics infrastructure. They were running a Large SQL Serverless warehouse with autoscaling from 1-5 clusters and even needed to upgrade to XL during peak reporting periods. Their architecture relied on:
- Real-time streaming data from a message queue into Delta Lake via continuous structured streaming
- A nightly job to consolidate streamed records into a historical table
- Query-time unions between the historical table and streaming data
- Complex aggregations and deduplication logic executed at query time
This approach meant that every customer dashboard refresh required intensive processing, leading to higher costs and slower response times.
From monitoring the SQL warehouse, there was significant queueing (yellow columns), with bursty periods of usage, where autoscaling properly engaged but was not able to keep up with workloads:
To diagnose the cause of queueing, we identified a few long-running queries and most frequently executed queries using the query history (AWS | Azure | GCP) and system tables to determine whether queueing was simply due to a high volume of relatively basic, narrow queries or if optimization was needed to improve poor-performing queries.
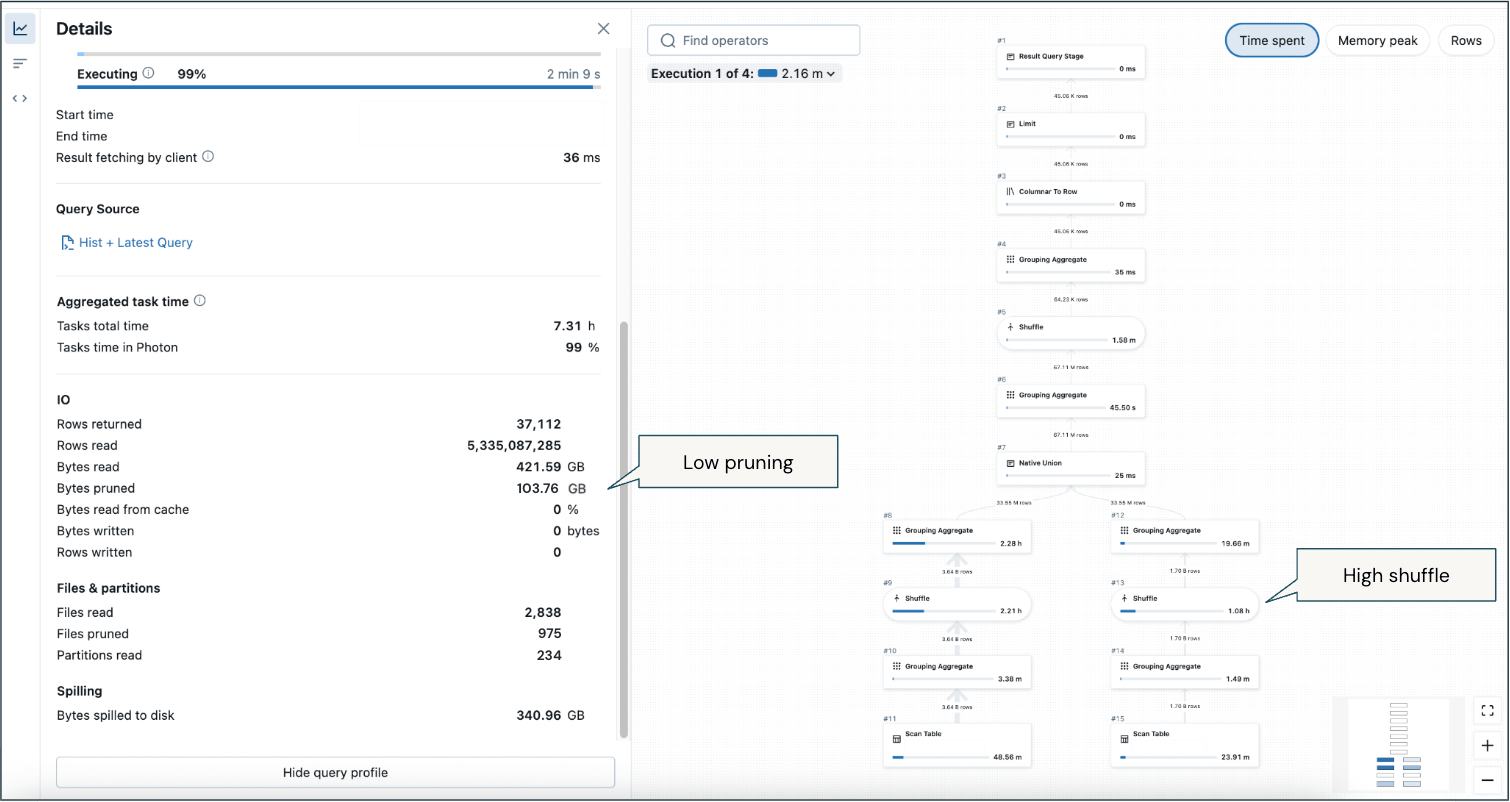
A few critical callouts from this example profile from a long-running query:
- Low pruning (despite significant filtering on time period to return the most recent 2 weeks) means a considerable amount of data is being scanned.
- High shuffle—there will inherently be shuffle due to analytical aggregations, but it is the majority of memory usage across historical and recent data.
- Spill to disk in some instances.
These learnings from observing critical queries led to optimization actions across compute, data layout and query techniques.
Optimization Approach
Working with a Databricks Delivery Solutions Architect, the platform implemented several key optimizations:
- Increased merge frequency: Changed from nightly to hourly merges, significantly reducing the volume of streaming data that needed processing at query time.
- Implement Materialized Views: Converted the aggregation table into a materialized view that refreshes incrementally each hour, pre-computing complex aggregation logic during refresh so that query-time processing is limited to only the most recent hour's data.
- Modern data organization: Switched from Hive-style partitioning to automatic liquid clustering, which intelligently selects optimal clustering columns based on query patterns and adapts over time.
Results
After a six-week discovery and implementation process, the platform saw immediate and remarkable improvements once deployed:
- Reduced infrastructure costs: Downsized from a Large serverless warehouse with autoscaling to a Small serverless warehouse with no autoscaling.
- Improved query performance: Lower latency for end-user dashboards, enhancing customer experience.
- Streamlined operations: Eliminated operational overhead from frequent end-user performance complaints and support cases.
An example of a query profile after optimization:
- As the file layout was optimized, more file pruning occurred to reduce the amount of data/files that needed to be read.
- No spill to disk.
- Shuffle still occurs because of analytical aggregations, but the amount of shuffling is significantly reduced due to more efficient pruning and pre-aggregated elements that don't need to be calculated at runtime.

This transformation demonstrates how applying data modeling best practices, leveraging serverless compute and utilizing Databricks advanced features like materialized views and liquid clustering can dramatically improve both performance and cost-efficiency.
Key Takeaways
- Focus your requirements on data warehouse concurrency, latency and scale. Then, use best practices, observability capabilities and tuning techniques to meet those requirements.
- Focus on right-sizing compute, implementing strong data layout practices (significantly helped by AI) and addressing data models and queries as the priority.
- The best data warehouse is a Databricks lakehouse—take advantage of innovative approaches that lead to new features, married with foundational data warehouse principles.
- Meet traditional data warehousing needs without sacrificing AI/ML (you're capitalizing on them with Databricks).
- Don't size and tune blindly; leverage built-in observability to monitor, optimize and automate cost-saving actions.
- Adopt Databricks SQL Serverless for optimal price performance and support the variable usage patterns typical of BI and analytics workloads.
Next Steps and Additional Resources
Achieving a high-concurrency, low-latency data warehouse that scales does not happen by following a boilerplate recipe. There are tradeoffs to consider, and many components all work together. Whether you're cementing your data warehousing strategy, in progress with an implementation and struggling to go live, or optimizing your current footprint, consider the best practices and framework outlined in this blog to tackle it holistically. Reach out if you'd like help or to discuss how Databricks can support all your data warehousing needs.
Databricks Delivery Solutions Architects (DSAs) accelerate Data and AI initiatives across organizations. They provide architectural leadership, optimize platforms for cost and performance, enhance developer experience and drive successful project execution. DSAs bridge the gap between initial deployment and production-grade solutions, working closely with various teams, including data engineering, technical leads, executives and other stakeholders to ensure tailored solutions and faster time to value. To benefit from a custom execution plan, strategic guidance and support throughout your data and AI journey from a DSA, please get in touch with your Databricks Account Team.
Get the latest posts in your inbox
Subscribe to our blog and get the latest posts delivered to your inbox.