Databricks Financial Services Lakehouse for Quantitative Research
by Ricardo Portilla, Boris Banushev, Eon Retief and Antoine Amend
Quantitative research emerged in the 1960s with a simple yet revolutionary idea: apply mathematics and statistics to finance. Where the fundamental approach relied on tedious manual processes and outdated information, quantitative trading embraced technology to evaluate real-time fluctuations in market conditions and obtain more accurate estimates of a company's market value. While there are clear benefits in leveraging computers to uncover underlying trends, this approach has certain shortcomings and risks, especially in times of high market volatility and complex geopolitical dynamics. Today's most successful hedge funds combine quantitative and fundamental investing approaches with a unified, human-in-the-loop strategy called quantamental investing.
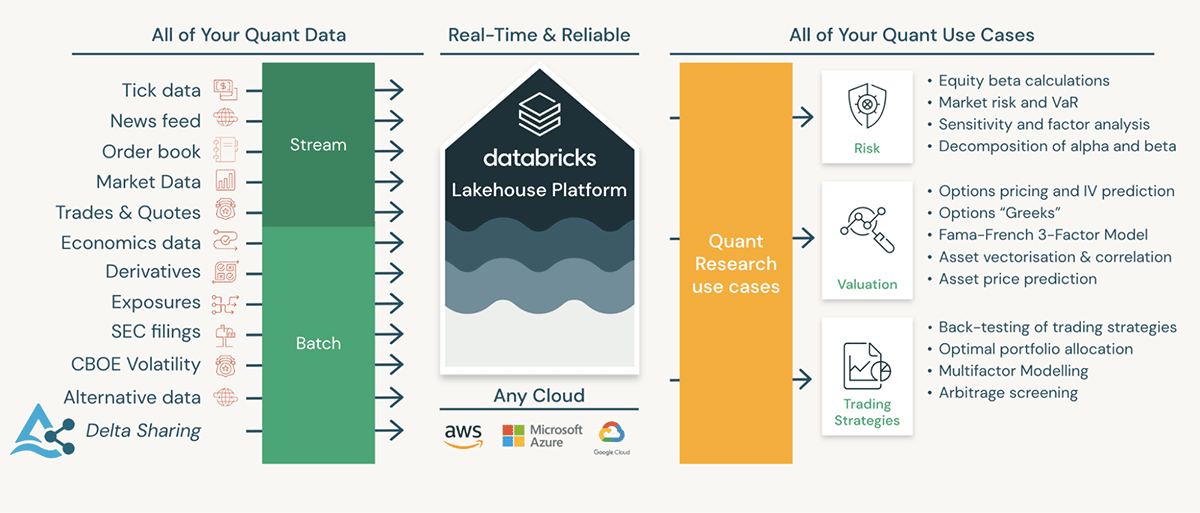
The Databricks Lakehouse for Financial Services offers the ability to unify business and technology in a single platform. It has become critical to the success of investment funds across several use cases. In this article, we will discuss some of the most common pain points observed in the industry and highlight the benefits of adopting the Databricks Lakehouse architecture to create a scalable and extensible investment data platform that will withstand the test of time.
𝛼. Team productivity
Reduce the time and effort of the hypothesis-to-model lifecycle
The success of any trading or investment firm lives and dies with the recency of its trading strategy (i.e., the rapidity of its execution). The productivity of the development teams is what sets the firm apart from its competitors. However, the role of a quantitative analyst (or quant for short) comprises a vast array of responsibilities. Quants have to source the appropriate datasets, implement strategies outlined in academic papers, test hypotheses, and back-test trading strategies against large volumes of historical data, to name a few tasks. Considering the expert level of knowledge required spanning economic theory, applied statistics, and distributed computing, it is clear that efficient cross-functional collaboration is vital to the optimal performance of any team and, ultimately, the investment firm.
A top-tier investment bank wanted to implement a statistical power divergence model. The original work was published using the R programming language, so the team had to rewrite the entire library in Python since their existing platform did not support the R language. This cost the business more than five weeks - time the team could have instead spent using the library to generate excess returns.
Quantitative research companies need to iterate over models quickly. The ability to create trading or risk-management models faster than competitors and other market participants offers a significant advantage and adds to the firm's competitive edge. Two features of Databricks, in particular, can help improve the efficiency and effectiveness of teams when using the Databricks Lakehouse: Notebooks and Repos.
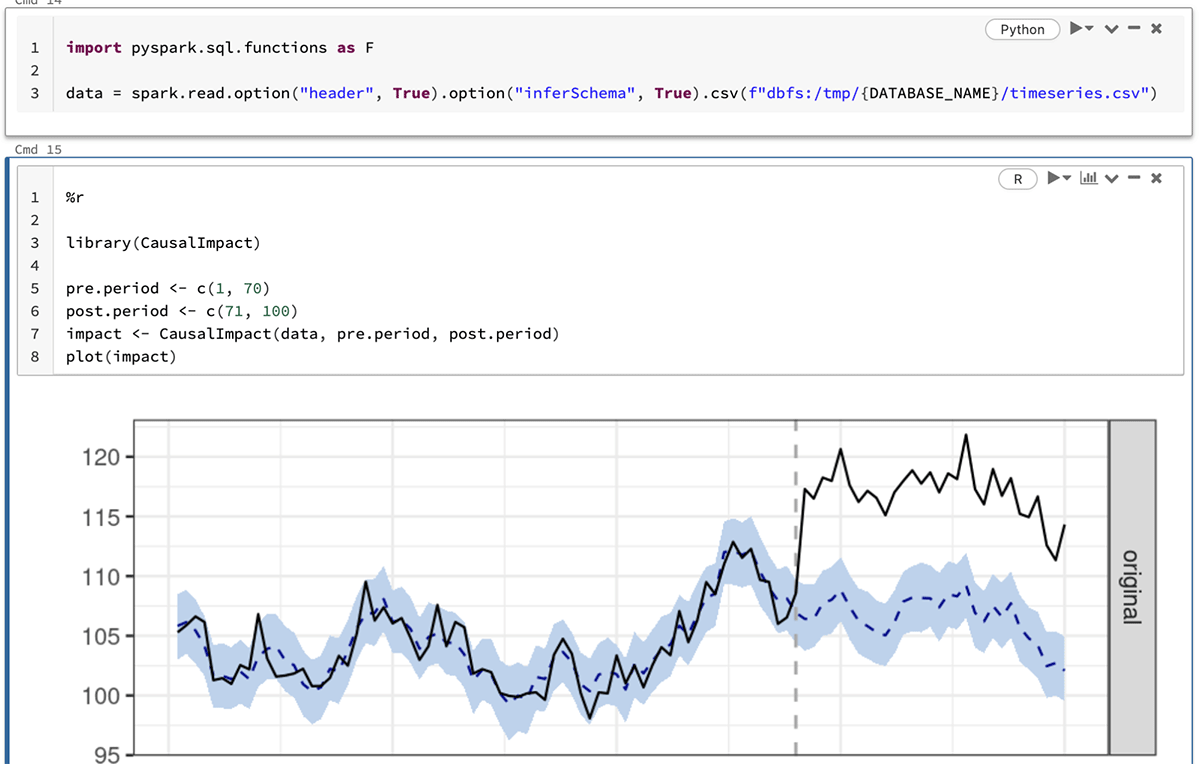
Databricks Notebooks provide a collaborative environment where teams can work alongside each other in a single Notebook while benefiting from capabilities such as inline comments, scheduling, and revision history. Notebooks also offer support for multiple programming languages. The example below shows how we can use R packages (like the CausalImpact library) to run causal-inference analyses on data prepared using Python instructions - all in the same notebook. We could just as easily use SQL in the same way.
Databricks Repos, on the other hand, offer the ability to standardize development across different projects, allowing users to integrate Notebooks into CI/CD pipelines, promote code changes between different branches (i.e., environments), and easily maintain code quality.
To demonstrate the Databricks Lakehouse differentiators for quantitative research and financial engineering, we developed comprehensive examples for real-time pricing models and implied volatility calculations for derivatives. One example depicts a day in the life of a quantitative researcher, covering the whole lifecycle of using an academic paper to create a model for predicting the implied volatility of stock options. Instead of spending weeks porting code from one programming language to another, we can use Databricks to codify a research idea and deliver a concrete back-test in minutes. This sets the stage for further improvements and increases the scale of back-tests.
𝜷. Scaling for the future
Good financial engineering is a massive data curation exercise
Moore's Law is the principle that the speed and capability of computers are expected to double every two years. Since the second half of the twentieth century, the battle for alpha has been fought with supercomputers and high-performance computing (HPC). Even today, quantitative traders still consider "floating-point operations per second" (or FLOPS) as a direct measure of their IT equipment's performance.
However, the fourth industrial revolution brought an increased focus on leveraging data and cloud computing, and with it, the end of Moore's law as we know it. Today, the battle over alpha is no longer fought with "FLOPS" but rather with "bytes". The ability of an investment firm to ingest and process large volumes of diverse datasets is essential for greater yields. Organizations that can successfully shift from a computer-first to a data-first approach will outperform those who cannot.
We have often heard companies saying that they must ingest dozens of new data sources every month to back-test models for risk management in times of high market volatility. At that rate, it becomes impossible to efficiently onboard new sources without leveraging technology to automate the critical practices and processes that ensure quality and trustworthiness in the data.
Capital markets are synonymous with processing significant volumes of information, which can pose a considerable challenge to scaling the data architecture. The true challenge, however, does not lie with the volume of data but rather the variety and velocity of data flowing through the organization. Mergers, for example, can cause symbology changes that require SCD Type 2 support to maintain the integrity of the data. Similarly, data corrections can require upserting prices and trade information, while incremental research on company sentiment would require support for materialized views and incremental processing.
After identifying all required data sources (including decades worth of tick data for hundreds of FX pairs and listed companies), a prominent hedge fund calculated that the volume of all data sums up to almost a petabyte, including near-real time and historical data, and in four file formats.
Another common scenario is when a market vendor changes the name of an attribute provided in data files. A more extreme case might involve a complete format change from CSV to XML. Both scenarios can cause long-running ETL jobs to fail. Robust data pipelines with native support for good data management practices are vital to ensure the reproducibility of results and deliver production-grade performance at scale.
Databricks Delta Live Tables (or DLT for short) provides a simple declarative framework for building, managing, and maintaining reliable data pipelines. DLT helps teams simplify their ETL development process with automated data validation, quality monitoring, and deep visibility for audit and recovery purposes. And DLT is backed by Delta Lake to provide native support for constraints enforcement and schema evolution.
Following the theme of constantly changing data and schemas, market data is inherently volatile, IPOs and market manipulation being primary examples. Delta Lake and structured streaming provide replay capabilities and allow users to combine batch and streaming data into the same pipeline. On top of this, DLT provides two breakthroughs in making streaming simple: a) near real-time auto-scaling capabilities that accommodate the changing market conditions without any particular logic, and b) change-data capture for SCD Type 1 patterns. The latter allows data engineering users to easily merge order book or tick data updates into batch data.
Building on our collection of examples, we created a solution accelerator to showcase calculating the beta correlation and deriving the expected return on equity using the Capital Asset Pricing Model (CAPM) for a few thousand US-listed companies. It demonstrates Delta Lake and DLT's flexibility and robustness in creating production-grade ETL pipelines with native support for data versioning, lineage, and quality management.
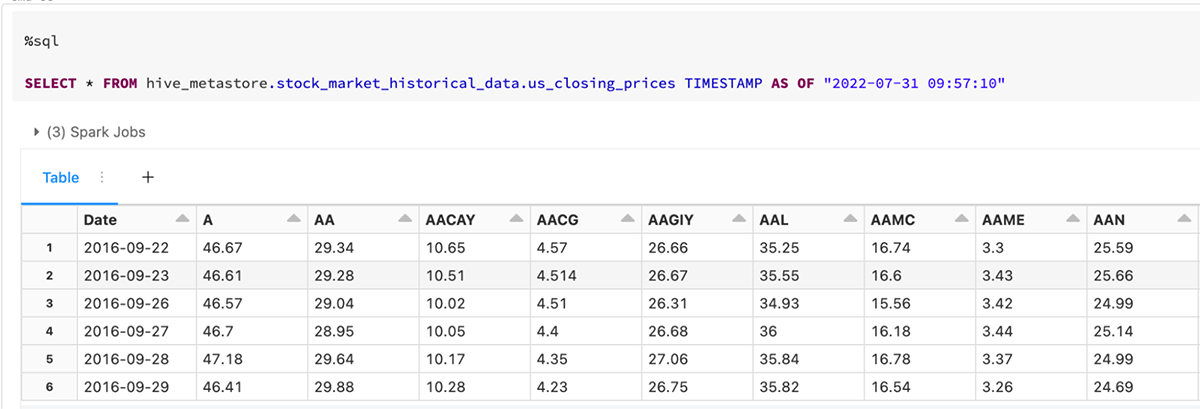
The image below shows how simple it is to query different versions of data with Delta Lake. This greatly aids with situations where we want to observe the version and quality of the raw data used to calculate the stock betas and CAPM at a specific time.
𝛾. Unified data governance
Data without limits does not mean operating without governance
As the investment firm adopts a data-first strategy to improve productivity and scalability, there will be an inevitable proliferation of subsequent use cases and requests for more, or alternative, data. While cloud technologies can aid with distributing data to the relevant teams, they do not directly address the governance issue. It's not enough to just provide access to data. We also need to manage that access and maintain oversight of how information is used. We have to think about enabling teams to search for the right source in this growing data repository. Innovation happens when we lower the cost of curiosity.
To address these governance issues, we can leverage Unity Catalog. Unity Catalog offers a unified solution for governing all data and artificial intelligence (AI) assets in the Databricks Lakehouse. It provides complete oversight of all files, tables, machine learning (ML) models, and dashboards housed within the lakehouse, irrespective of which cloud vendor supports the storage or compute resources.
Most models developed by quant teams will diminish in effectiveness once market conditions change or other actors cause significant movements in the market. The ability to quickly analyze key trends and identify alternative or additional sources of information that could improve a model is vital to maintain alpha. Unity Catalog offers automated lineage over all workloads with built-in support for data search and discovery. This allows quants to quickly find, understand, and reference data from across the entire data estate and alter or improve models to maintain their effectiveness in the market. Having end-to-end oversight of lineage further enables teams to reuse existing assets created by peers to accelerate the development of downstream use cases.
It's also important to consider the rate of change in volatile markets. Quants are under immense pressure to revise or adjust a trading strategy or model as quickly as possible. Unity Catalog offers low-latency metadata serving and table auto-tuning to improve query performance. At the same time, asynchronous data compaction optimizes file sizes and automatically reduces input/output (I/O) latency in the background. This means that quants can find, understand and leverage the right data assets quicker to preserve and improve yields.
Putting it all together
While it's possible to leverage any one component of the Databricks Lakehouse on its own, the optimal value is delivered when we use all these services to create a simple, open, and unified data platform. The image below provides a simple reference architecture for how quantitative organizations can build a modern data-driven research platform.
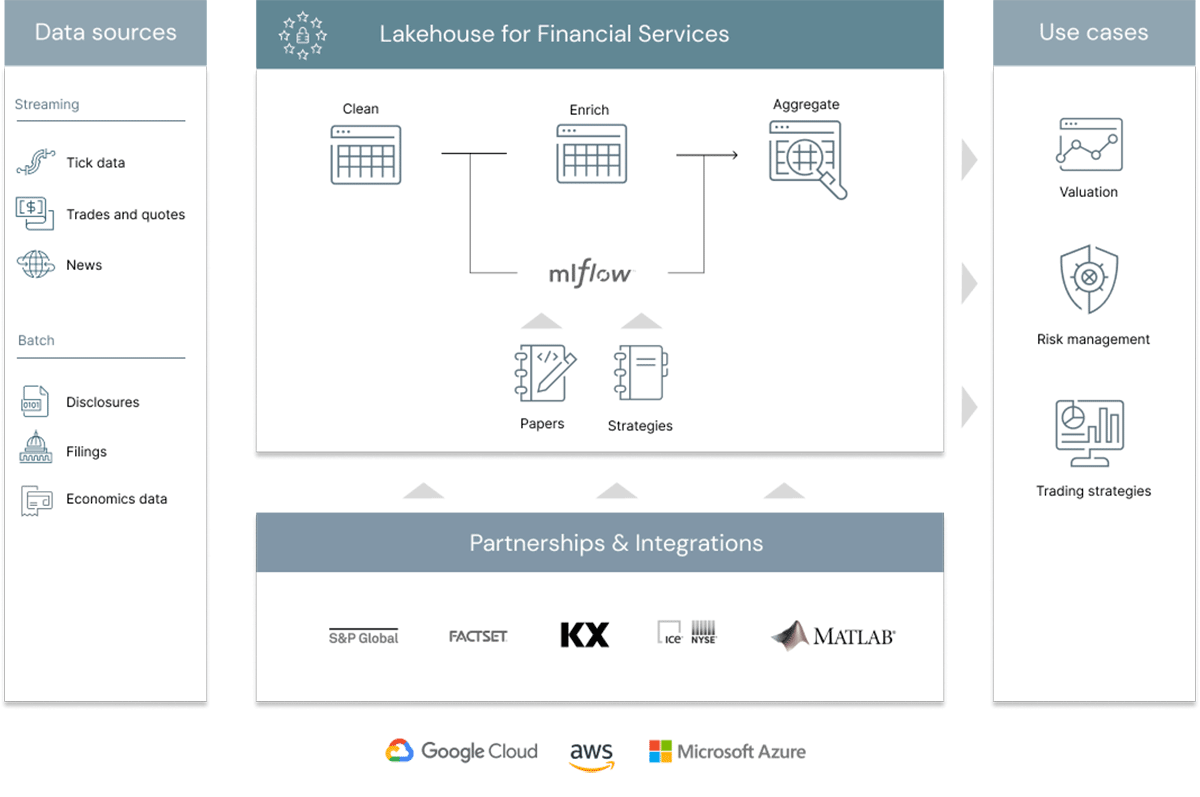
Batch and streaming sources are seamlessly merged and delivered to a bronze (or raw) layer. Data is checked for quality issues (e.g., heteroskedasticity, multicollinearity, biases, etc.). The cleaned output is delivered to a silver layer. The silver layer becomes the primary source for quant teams to test hypotheses, create new ML services, or run queries to support interactive dashboards and reports. A single source of truth, no matter what the use case.
Over and above the core Lakehouse services discussed, teams also have access to a managed version of MLflow. MLflow simplifies the entire MLOps lifecycle, allowing quants to experiment with different ML strategies and promote models to a managed registry once cleared for production deployment. Additionally, MLflow Pipelines enable teams to build production-grade workflows to automate and scale the entire MLOps process. This can significantly reduce the time required by quants to progress models from research to development to production, allowing firms to capture potential gains as quickly as possible.
Conclusion
The technology and data landscape has changed drastically since the early days of quantitative trading. Many trading firms have successfully transitioned from a "compute-first" approach to a "data-first" operating model, fostering team collaboration and embracing open source technologies rather than relying on individual performance and proprietary systems.
Through enhanced collaboration (single Notebooks and across different languages), the auto-scaling burst capacity, and reliable data-centric capabilities, the Databricks Lakehouse takes the research to production-ready quantitative models lifecycle from months to minutes. As a result, quantitative research teams avoid time spent on data copy, delayed data, and painstaking code migration. When the data lake is the single source of truth that supports streaming, CDC, and statistical back-testing, quant researchers can instead increase iteration speed, resulting in a competitive edge and data-driven investment strategies. This is the Databricks Lakehouse for Financial Engineering.
For more information on Lakehouse for Financial Services, please visit our website and our various solution accelerators and data partnerships using Delta sharing.
Get the latest posts in your inbox
Subscribe to our blog and get the latest posts delivered to your inbox.