How Observability in Lakeflow Helps You Build Reliable Data Pipelines
Lakeflow’s suite of observability features provides data engineers with the tools to confidently maintain efficient, reliable, and healthy data pipelines at scale.
by Theresa Hammer and Joanna Zouhour
- Databricks Lakeflow helps you build reliable, healthy, and fresh data pipelines with built-in observability
- Data practitioners gain quick access to critical jobs and pipeline data through a single UI for end-to-end visibility
- Lakeflow supports proactive alerting, fast root cause analysis, and troubleshooting
As data volume grows, so do the risks for your data platform: from stale pipelines to hidden errors and runaway costs. Without observability integrated into your data engineering solution, you are flying blind and risking impacting not just the health and freshness of your data pipelines, but also missing serious issues in your downstream data, analytics, and AI workloads. With Lakeflow, Databricks’ unified and intelligent data engineering solution, you can easily tackle this challenge with built-in observability solutions in an intuitive interface directly within your ETL platform, on top of your Data Intelligence.
In this blog, we will introduce Lakeflow’s observability capabilities and show how to build reliable, fresh, and healthy data pipelines.
Observability is Essential for Data Engineering
Observability for data engineering is the ability to discover, monitor, and troubleshoot systems to ensure the ETL operates correctly and effectively. It is the key to maintaining healthy and reliable data pipelines, surfacing insights, and delivering trustworthy downstream analytics.
As organizations manage an increasingly growing number of business-critical pipelines, monitoring and ensuring the reliability of a data platform has become vital for a business. To tackle this challenge, more data engineers are recognizing and seeking the benefits of observability. According to Gartner, 65% of data and analytics leaders expect data observability to become a core part of their data strategy within two years. Data engineers who want to stay current and find ways to improve productivity, while driving stable data at scale, should implement observability practices in their data engineering platform.
Establishing the right observability for your organization involves bringing the following key capabilities:
- End-to-end visibility at scale: eliminate blind spots and uncover system insights by easily viewing and analyzing your jobs and data pipelines in one single location
- Proactive monitoring and early failure detection: identify potential issues as soon as they arise, before they impact anything downstream
- Troubleshooting and optimization: fix problems to ensure the quality of your outputs and optimize your system's performance to improve operational costs
Read on to see how Lakeflow supports all of these in a single experience.
End-to-End Visibility at Scale into Jobs and Pipelines
Effective observability begins with complete visibility. Lakeflow comes with a variety of out-of-the-box visualizations and unified views to help you stay on top of your data pipelines and make sure your entire ETL process is running smoothly.
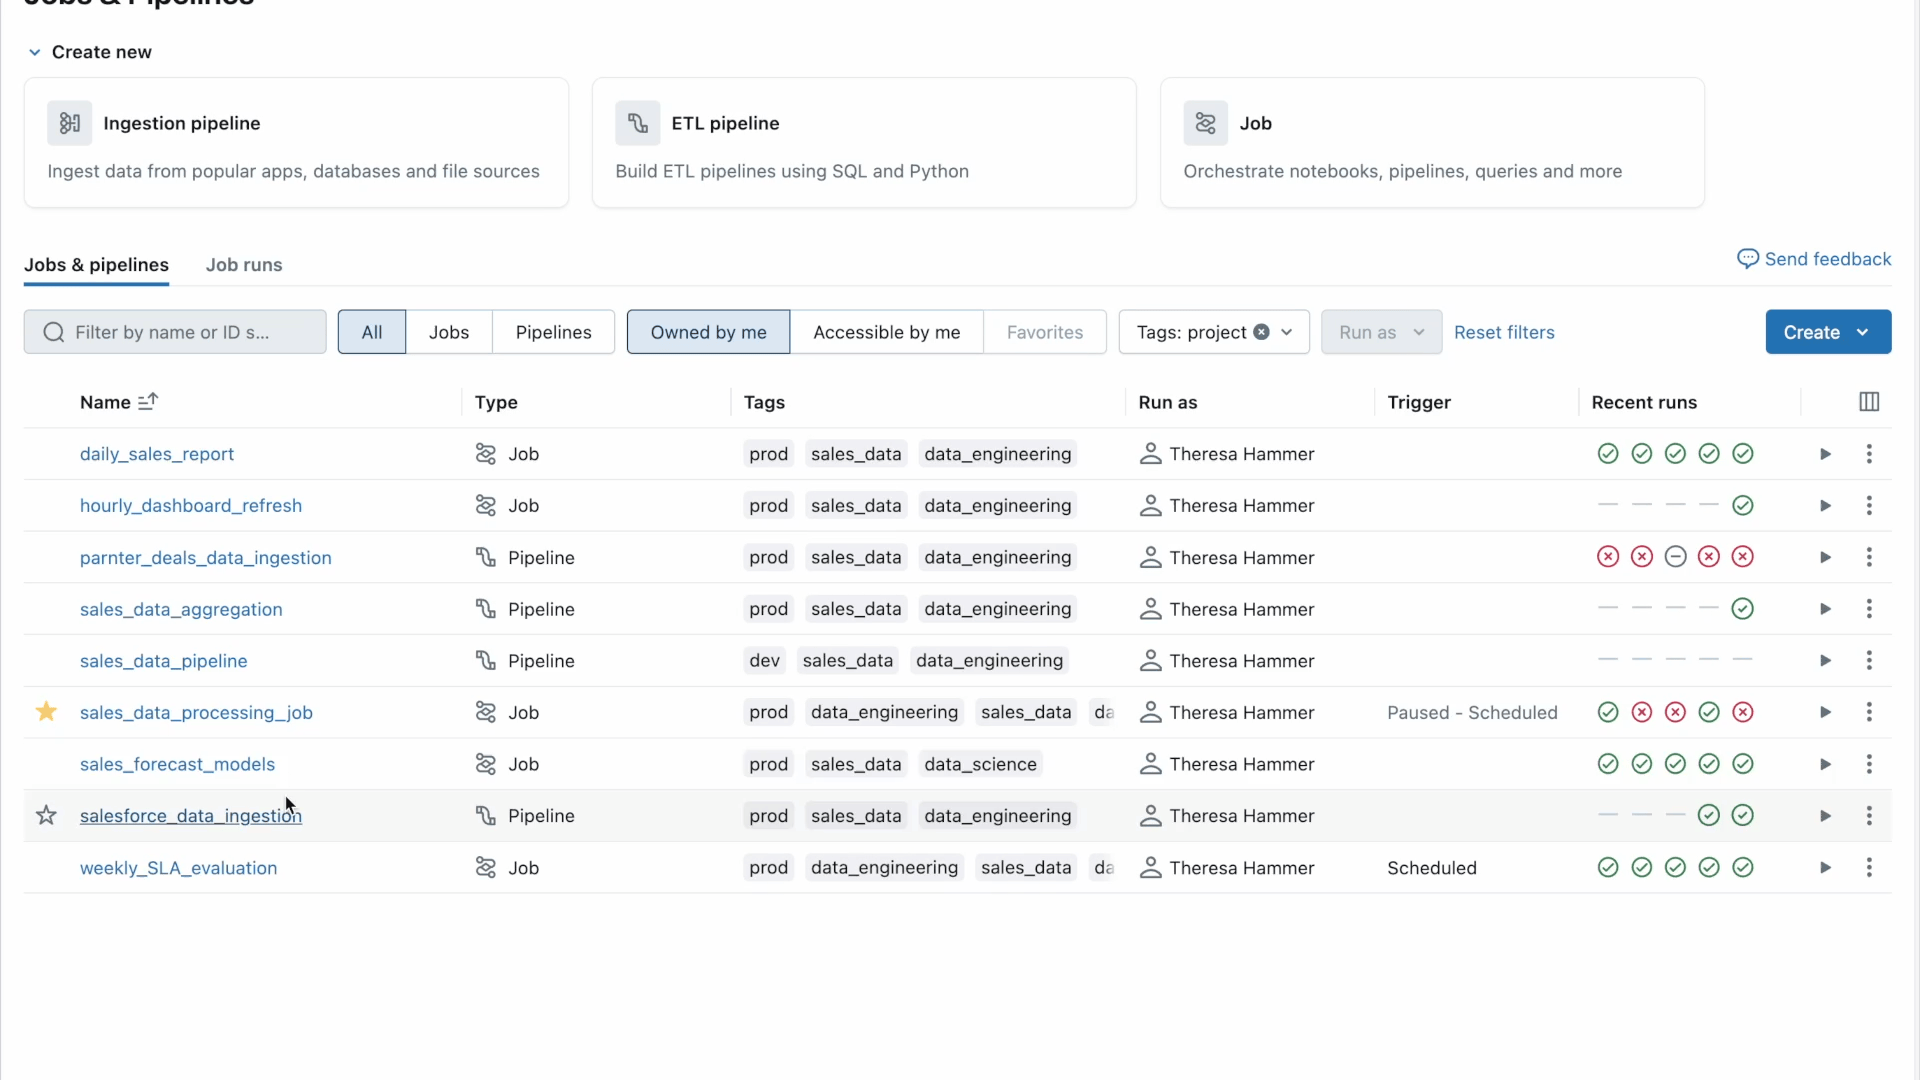
Fewer Blind Spots with a centralized and granular view of your jobs and pipelines
The Jobs and Pipelines page centralizes access to all your jobs, pipelines, and their run history across the workspace. This unified overview of your runs simplifies the discovery and management of your data pipelines and makes it easier to visualize executions and track trends for more proactive monitoring.
Looking for more information about your Jobs? Just click on any job to go to a dedicated page that features a Matrix View and highlights key details like status, duration, trends, warnings, and more. You can:
- easily drill down into a specific Job run for additional insights, such as the graph view to visualize dependencies or point of failure
- zoom in to see the task level (like pipeline, notebook output, etc.) for more details, such as streaming metrics (available in Public Preview).
Lakeflow also offers a dedicated Pipeline Run page where you can easily monitor the status, metrics, and track progress of your pipeline execution across tables.
More insights with visualization of your data at scale
In addition to these unified views, Lakeflow provides historical observability for your workloads to get insights into your usage and trends. Using System Tables, Databricks-managed tables that track and consolidate every job and pipeline created across all workspaces in a region, you can build detailed dashboards and reports to visualize your jobs and pipelines’ data at scale. With the recently updated interactive dashboard template for Lakeflow System Tables, it’s much easier and faster to:
- track execution trends: easily surface insights around job behavior over time for better data-driven decisions
- identify bottlenecks: detect potential performance issues (covered in more detail in the following section)
- cross-reference with billing: improve cost monitoring and avoid billing surprises
System Tables for Jobs and Pipelines are currently in Public Preview.

Visibility extends beyond just the task or job level. Lakeflow’s integration with Unity Catalog, Databricks’ unified governance solution, helps complete the picture with a visual of your entire data lineage. This makes it easier to trace data flow and dependencies and get the full context and impact of your pipelines and jobs in one single place.

Proactive Monitoring, Early Detection of Job Failures, Troubleshooting, and Optimization
As data engineers, you’re not just responsible for monitoring your systems. You also need to be proactive about any issues or performance gaps that might come up in your ETL development and address them before they impact your outputs and costs.
Proactive Alerting To Catch Things Early
With Lakeflow’s native notifications, you can choose if and how to be alerted about critical job errors, durations, or backlogs via Slack, email, or even PagerDuty. Event hooks in Lakeflow Declarative Pipelines (currently in Public Preview) give you even more flexibility by defining custom Python callback functions so you decide what to monitor or when to be alerted on specific events.
Faster Root Cause Analysis For Quick Remediation
Once you receive the alert, the next step is to understand why something went wrong.
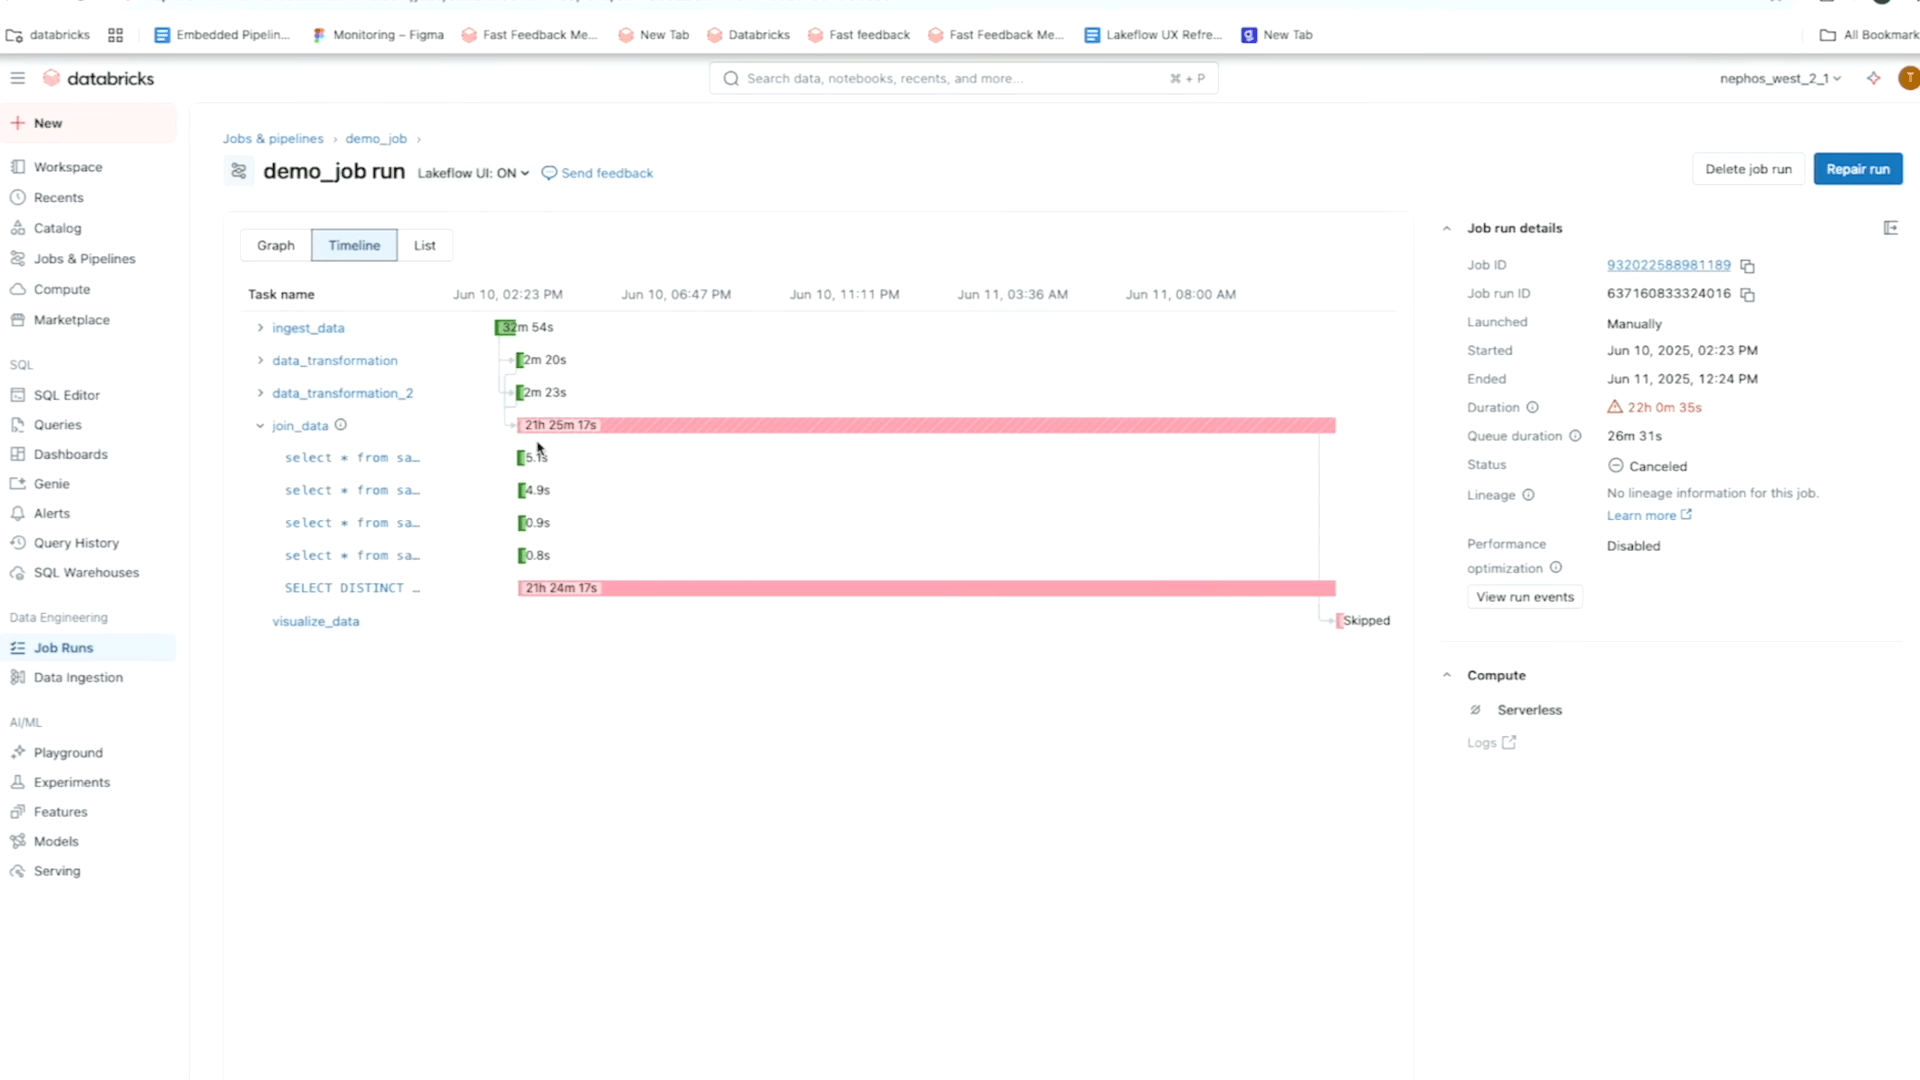
Lakeflow allows you to jump from the notification directly into the detailed view of a specific job or task failure for in-context root cause analysis. The level of detail and flexibility with which you can see your workflow data allows you to easily identify what exactly is responsible for the error.
For instance, using the matrix view of a job, you can track failure and performance patterns across tasks for one specific workflow. Meanwhile, the timeline (Gantt) view breaks down the duration of each task and query (for serverless jobs) so you can spot slow performance issues in one job and dig deeper for root causes using Query Profiles. As a reminder, Databricks’ Query Profiles show a quick overview of your SQL, Python, and Declarative Pipeline executions, making it easy to identify bottlenecks and optimize workloads in your ETL platform.
You can also rely on System Tables to make root cause analysis easier by building dashboards that highlight irregularities across your jobs and their dependencies. These dashboards help you quickly identify not just failures but also performance gaps or latency improvement opportunities, such as latency P50/P90/P99 and cluster metrics. To complement your analysis, you can leverage lineage data and query history system tables, so you can easily track upstream errors and downstream impacts through data lineage.
Debugging and Optimization for Reliable Pipelines
In addition to root cause analysis, Lakeflow gives you tools for quick troubleshooting, whether it’s a cluster resource issue or a configuration error. Once you’ve addressed the issue, you can run the failed tasks and their dependencies without re-running the entire job, saving you computational resources. Facing more complex troubleshooting use cases? Databricks Assistant, our AI-powered assistant (currently in Public Preview), provides clear insights and helps you diagnose errors in your jobs and pipelines.

We’re currently developing additional observability capabilities to help you better monitor your data pipelines. Soon, you will also be able to view your workflows and pipelines’ health metrics and better understand the behavior of your workloads with indicators and signals emitted from Jobs and Pipelines.
Summary of Lakeflow's Observability Capabilities
Key Observability Pillars | Lakeflow Capabilities |
End-to-end visibility at scale |
|
Start Building Reliable Data Engineering with Lakeflow
Lakeflow offers the support you need to ensure your jobs and pipelines run smoothly, are healthy, and operate reliably at scale. Try our built-in observability solutions and see how you can build a data engineering platform ready for your data intelligence efforts and business needs.
- Learn more about Lakeflow Observability
- Watch the Lakeflow Observability session from our Data+AI summit on demand
Get the latest posts in your inbox
Subscribe to our blog and get the latest posts delivered to your inbox.