Scrappy Halloween Insights: How We Used Databricks and Chewy Data to Identify Trendy Pet Costumes
by Jon Van Hofwegen, Kunal Marwah, Michelle Liu and Mikaila Garfinkel
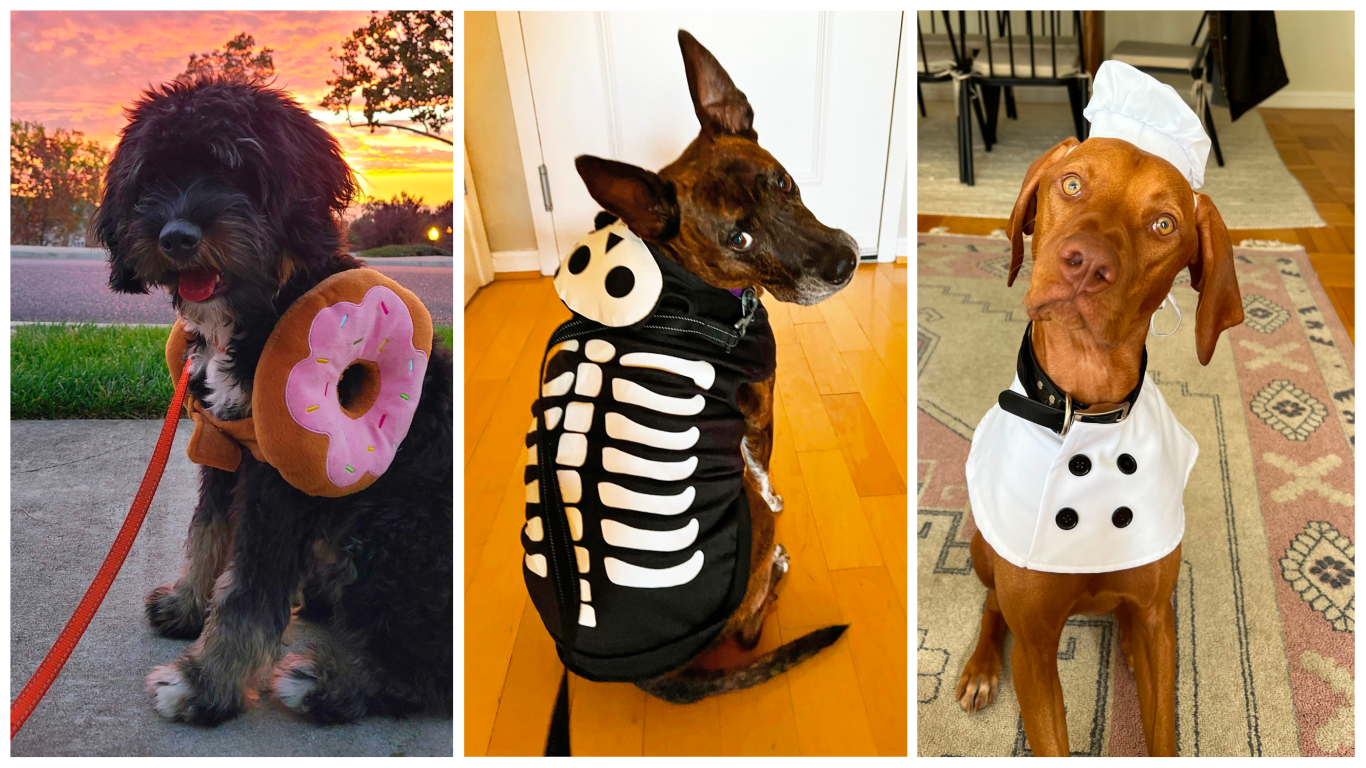
This year, as part of its annual Halloween consumer survey and report, the NRF expected U.S. consumers to spend $10.6 billion on Halloween costumes, surpassing last year’s already record-breaking number. A growing portion of this spend, $700 million in 2022, is toward pet costumes. And we can’t blame them. Below are some of our own Brickster’s pet costumes – how can you resist?
For some post-Halloween fun, we thought it’d be a perfect opportunity to dive deeper into these consumer trends and insights using Databricks. More specifically, we wanted to answer questions such as: what are the most popular Halloween costumes for pets, and, how much are people willing to spend on pet costumes?
This blog walks through how we answered these questions using data from Chewy, a leading online retailer of pet supplies, and Databricks SQL. Not only is this a great excuse to look at some cute pet pics, but it also provides insights into a growing consumer market and showcases a few potential use cases simplified by the Databricks Lakehouse Platform.
Our Approach
The Lakehouse is a one-stop shop for all your data needs, and this project served as a good example to reiterate that. Within a few hours, we were able to develop an end-to-end solution to extract, store and visualize this information while providing interesting business insights. If we had used traditional methods, we would have to:
- Use a tool to run python scripts,
- Use a database to store this info in different tables and
- Use a BI tool to create different visualizations
This may have led to extended development and the involvement of different personas. However, the Databricks Lakehouse Platform empowers the end user to leverage all these capabilities with just a few clicks.
For this project, we used publicly accessible data from Chewy, specifically from the costume section of their Halloween shop. We selected this data set because Chewy is one of the most popular pet retail websites, all the Halloween items are conveniently categorized together, and it offers 100+ Halloween costumes. To grab this information from Chewy, we used an open source python library called beautiful soup and were able to capture costume metadata including costume name, brand, category, price and number of reviews. Using the Databricks platform's Python capabilities we were able to parse each item's review data in just a few minutes.
Once collected, we loaded this information into a Delta Table, after which we used Databricks SQL to develop different metrics, which gave us the following insights.
The Hottest Pet Costumes of 2022
The first question we answered was: what are the most popular Halloween pet costumes this year? While Chewy does not provide the sales for each costume listing, we used customer review data to drive our own insights. For our analysis, we ranked the popularity of a costume based on the number of product reviews of each listing. For example, a product with the highest number of reviews would be defined as the most popular. With this approach, we ranked the 10 most popular costumes:
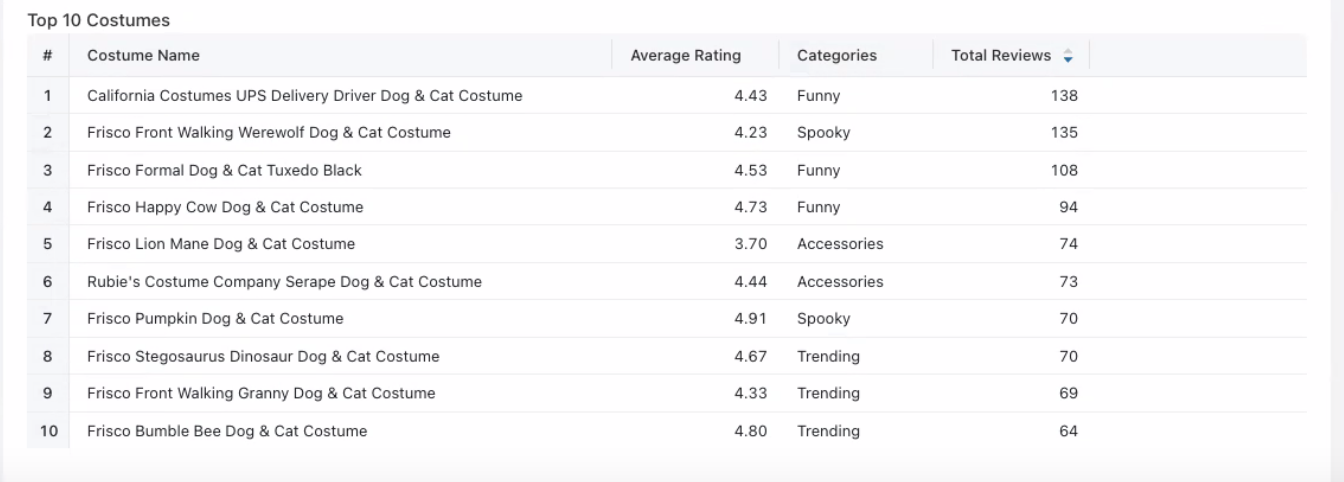
There is some alignment with NRF’s consumer survey, conducted in September; more specifically, they identified a bee, pumpkin, and lion as among the 10 most popular costumes.
While this gave us a general idea of what’s trending, we needed a larger snapshot to obtain broader insights. To give us a more holistic view, we created a visual with all of the 100+ costumes categorized. Note that Chewy provides a larger number of categories and costume types, so we bundled these together to create 9 distinct categories. For example, trending describes costumes with pop-culture references, while classic describes traditional costumes like a pumpkin or pirate.
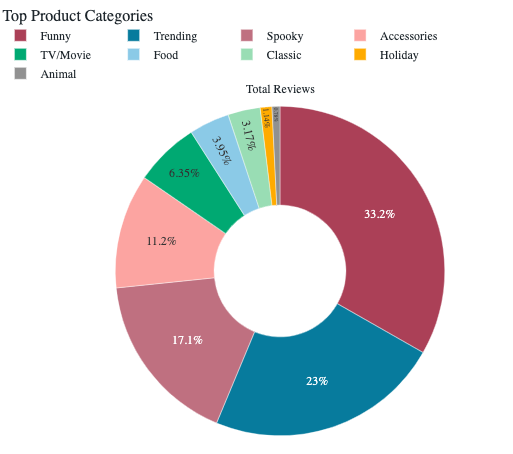
As the above chart shows, Trending and Funny were overall the most popular categories for consumers. This does seem to align with the fact that, as stated in the above survey, social media is a large, and growing, factor for Halloween costume inspiration. With this in mind, dressing your pet in something comical or in reference to a trending/pop-culture theme is likely to garner more attention than a traditional, less-original costume.
Understanding The Customer
Another aspect that heavily influences purchasing decisions is pricing. This piqued our interest: How much are consumers willing to spend on their pets for Halloween?
To find out, we created four pricing tiers, with less than $10 at the low end and $20-$25 the high end (only one costume exceeded $25, which we deemed an outlier). We then segmented the popularity as follows:
- 4.5 stars or higher: Most Liked
- 4.0 - 4.49 stars: Very Popular
- 3.5 - 3.99 stars: Popular
- 3.0 - 3.49 stars: Mildy Popular
- Less than 3 stars: Not Liked
Here’s the final result:
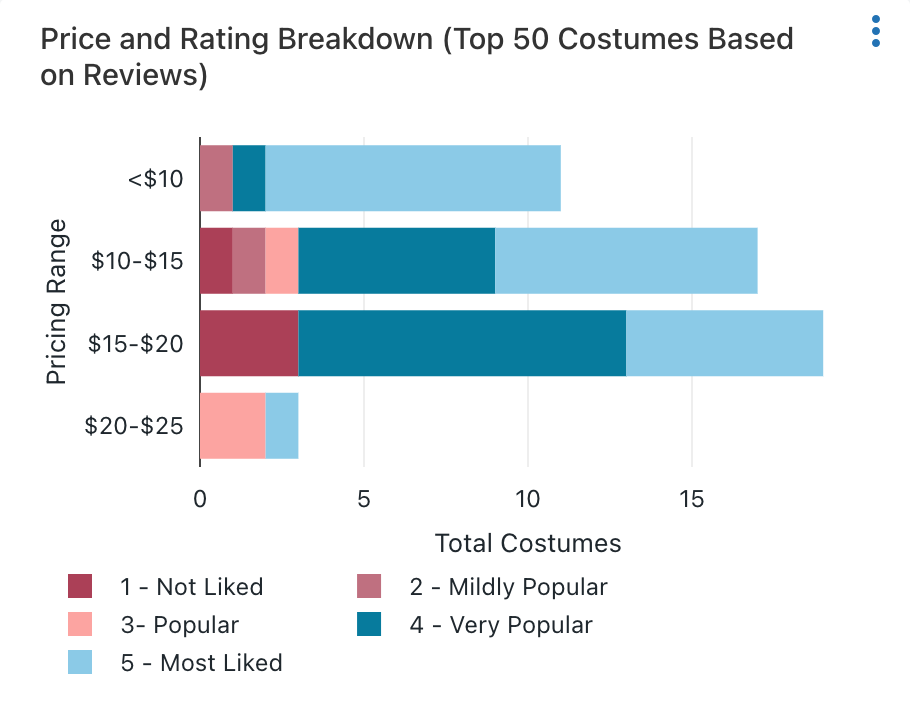
The above chart shows that the most popular items are most often the least expensive, with a vast majority falling between $10 and $15. This does make sense, however, as it seems unrealistic to expect consumers to drop a small fortune on a costume that will theoretically be worn once - especially with social media being a huge driver, and an increasing pressure to be different and stand out each year.
Many Databricks customers perform advanced analytics to understand customer intent and sentiment. While our limitations prevented us from performing anything nearly as robust - by a long shot - we decided to use the actual customer reviews to create a word cloud:
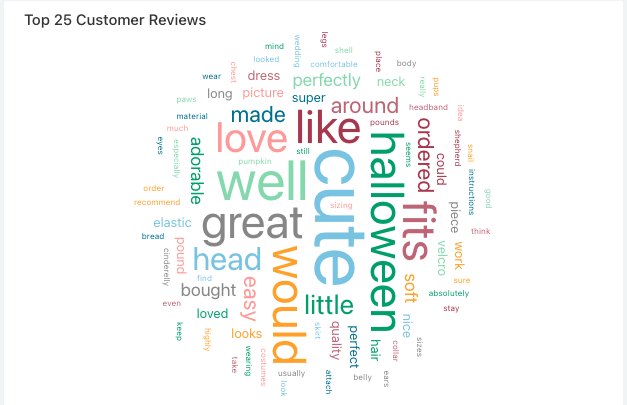
As the above visual shows, the biggest criteria for customers is that the costume was cute, whereas terms like quality and material are deemed of lower importance. Essentially, aesthetics trump everything else.
Conclusion
While this blog post is intended to showcase analytics with Databricks through a fun use case, it does provide a glimpse into some of the insights Databricks SQL can drive in a fraction of the time with traditional data architectures. If you found this interesting, check out our blog 100 Years of Horror Films: An Analysis Using Databricks SQL.
Get the latest posts in your inbox
Subscribe to our blog and get the latest posts delivered to your inbox.