Modern Industrial IoT Analytics on Azure - Part 3
Customers Leverage Azure Databricks for Industrial IoT Analytics
by Samir Gupta, Lana Koprivica and Hubert Duan
In part 2 of this three-part series on Azure data analytics for modern industrial internet of things (IIoT) applications, we ingested real-time IIoT data from field devices into Azure and performed complex time-series processing on Data Lake directly. In this post, we will leverage machine learning for predictive maintenance and to maximize the revenue of a wind turbine while minimizing the opportunity cost of downtime, thereby maximizing profit.
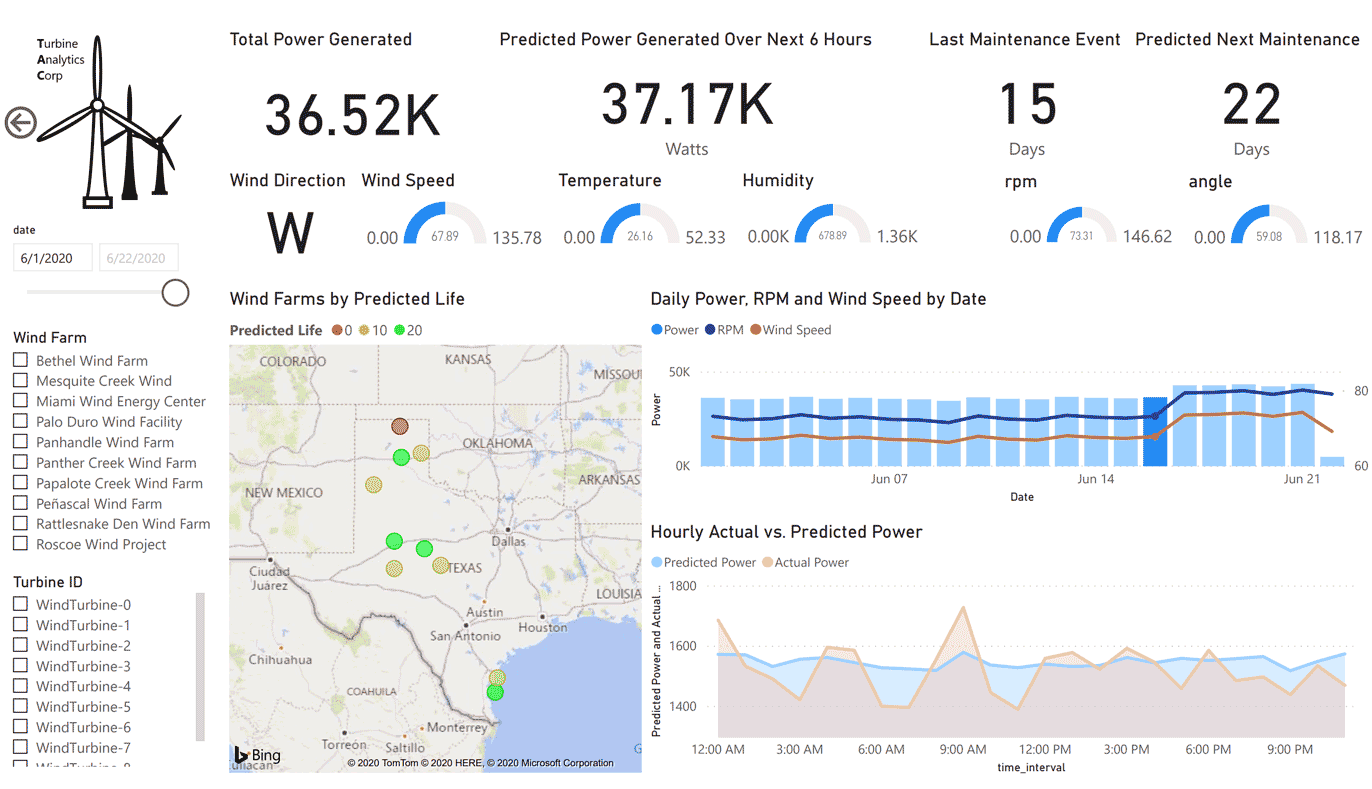
The end result of our model training and visualization will be a Power BI report shown below:
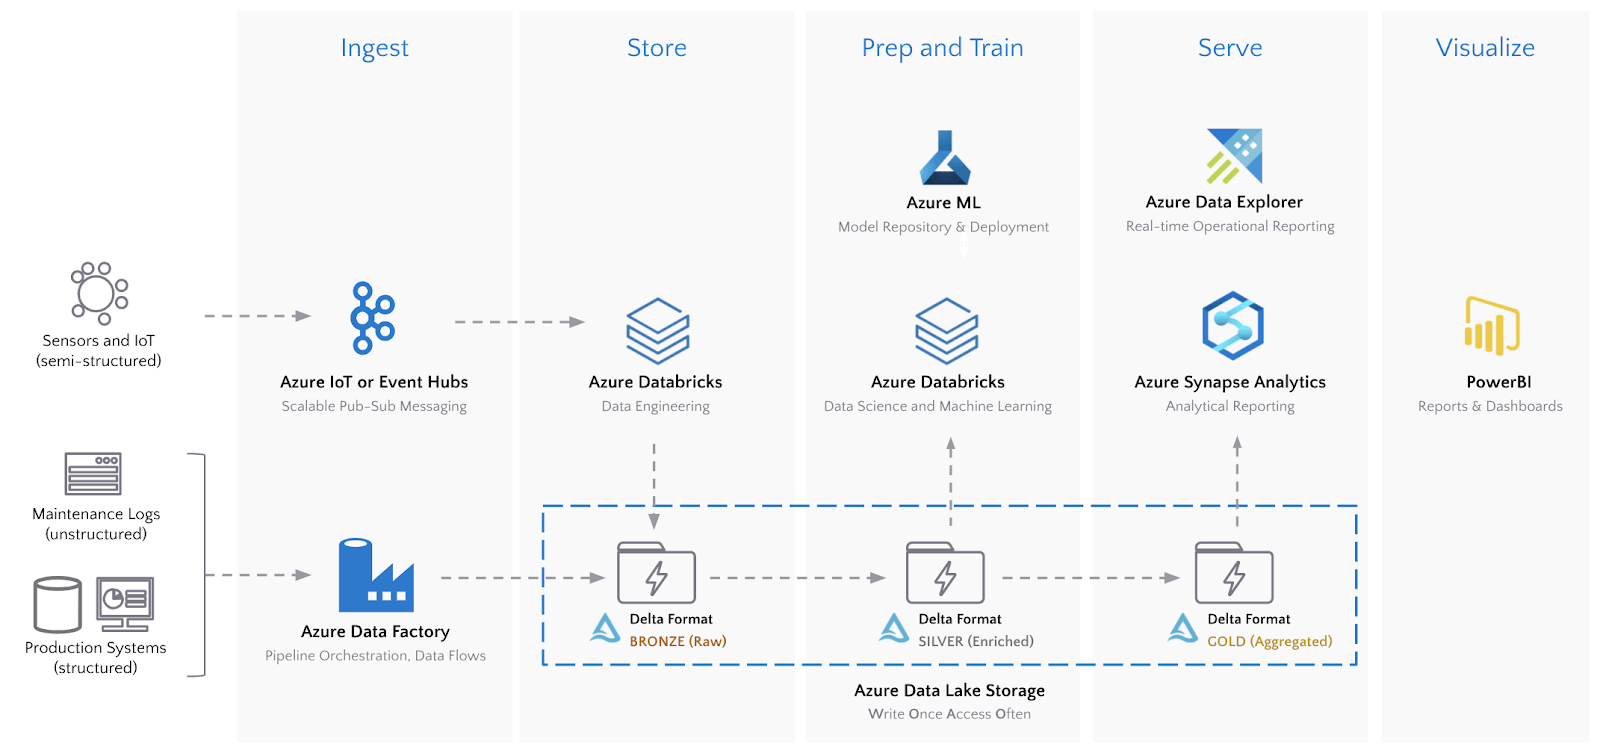
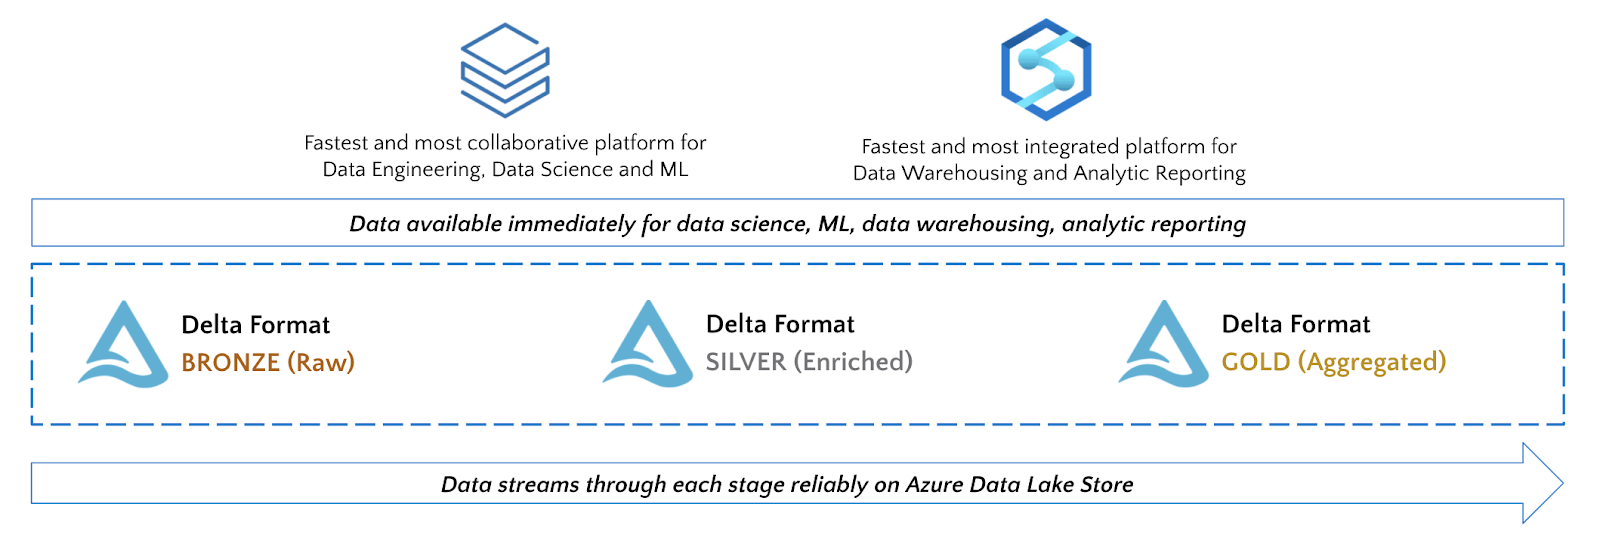
The end-to-end architecture is again shown below.
Machine Learning: Power Output and Remaining Life Optimization
Optimizing the utility, lifetime, and operational efficiency of industrial assets like wind turbines has numerous revenue and cost benefits. The real-world challenge we explore in this article is maximizing the revenue of a wind turbine while minimizing the opportunity cost of downtime, thereby maximizing our net profit.
Net profit = Power generation revenue - Cost of added strain on equipment
If we push a turbine to a higher RPM, it will generate more energy and therefore more revenue. However, the added strain on the turbine will cause it to fail more often, introducing cost.
To solve this optimization problem, we will create two models:
- Predict the power generated of a turbine given a set of operating conditions
- Predict the remaining life of a turbine given a set of operating conditions
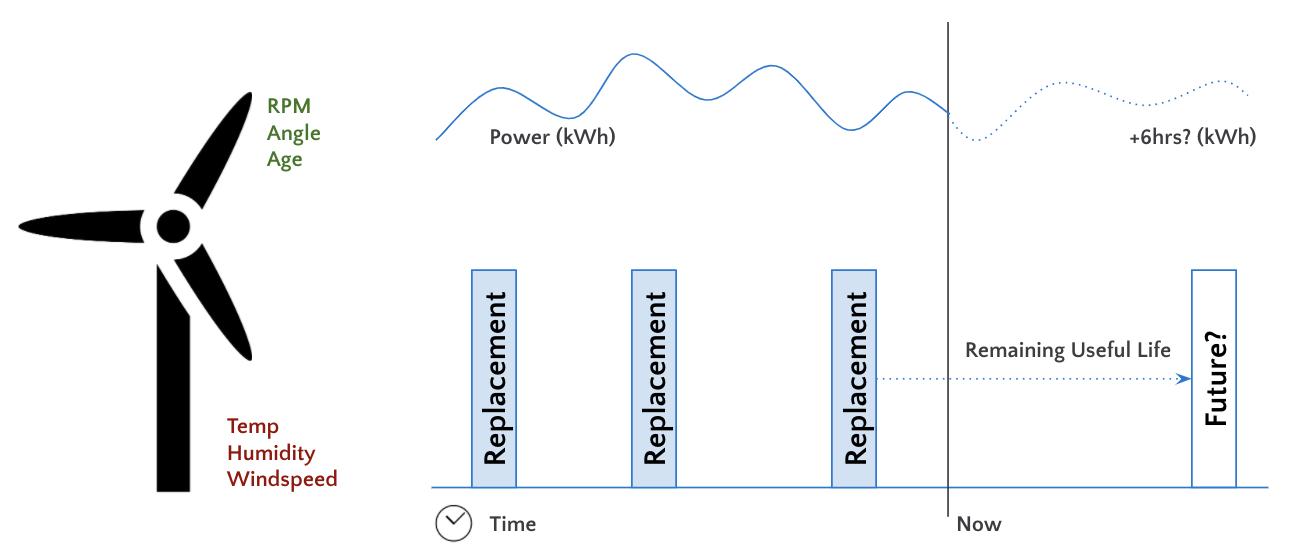
We can then produce a profit curve to identify the optimal operating conditions that maximize power revenue while minimizing costs.
Using Azure Databricks with our Gold Delta tables, we will perform feature engineering to extract the fields of interest, train the two models, and finally deploy the models to Azure Machine Learning for hosting.
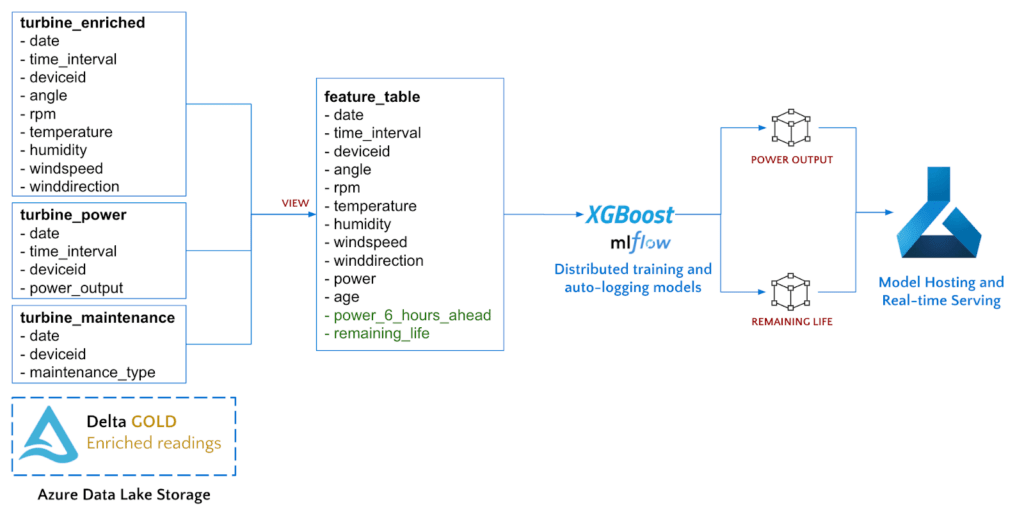
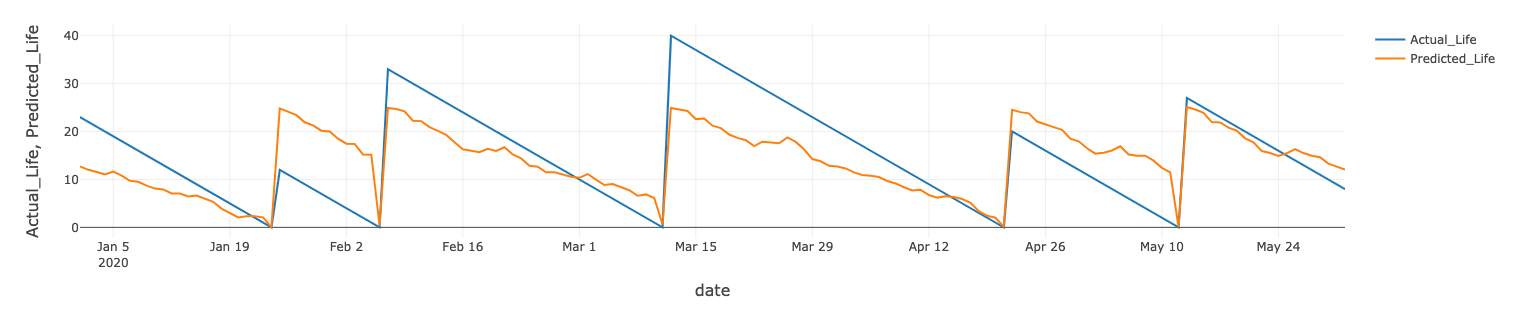
To calculate the remaining useful lifetime of each Wind Turbine, we can use our maintenance records that indicate when each asset is replaced.
To predict power output at a six-hour time horizon, we calculate time series shifts using Spark window functions.
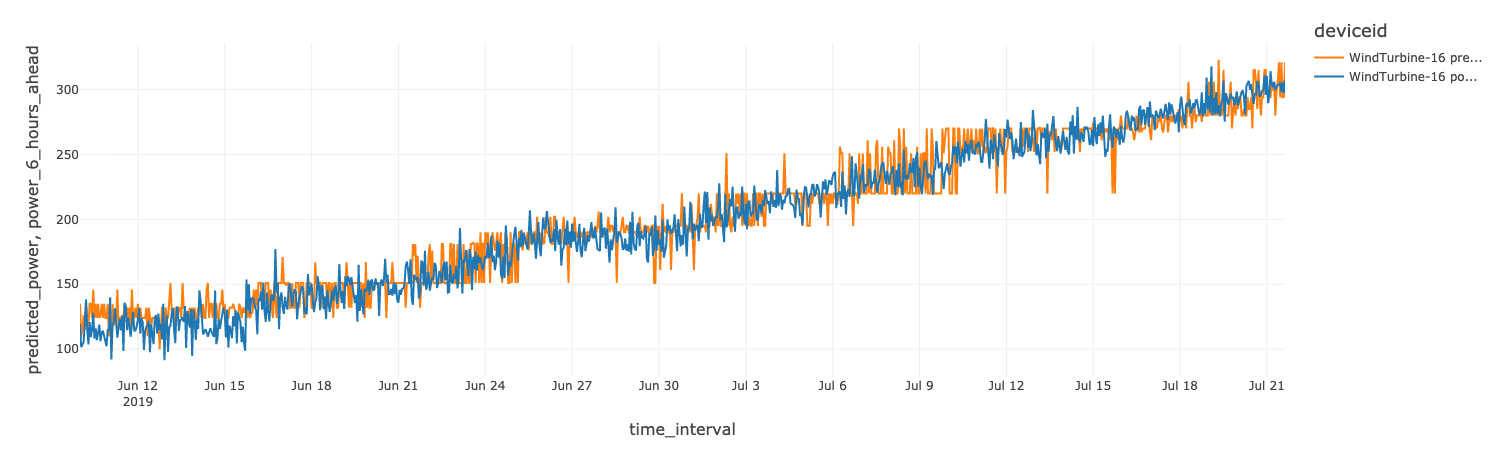
Azure Databricks will automatically track each model training run with a hosted MLflow experiment. For XGBoost Regression, MLflow will track any parameters passed into the params argument, the RMSE metric, the turbine this model was trained on, and the resulting model itself. For example, the RMSE for predicting power on deviceid WindTurbine-18 is 45.79.
We can train a similar model for the remaining life of the wind turbine. The actuals vs. predicted for one of the turbines is shown below.
Model Deployment and Hosting
Azure Databricks is integrated with Azure Machine Learning for model deployment and scoring. Using the Azure ML APIs directly inside of Databricks, we can automatically deploy an image for each model to be hosted in a fast, scalable container service (ACI or AKS) by Azure ML.
Once the model is deployed, it will show up inside the Azure ML studio, and we can make REST API calls to score data interactively.
Now that both the power optimization and the RUL models are deployed as prediction services, we can utilize both in optimizing net profit from each wind turbine.
Assuming $1 per KWh, annual revenue can simply be calculated by multiplying the expected hourly power by 24 hours and 365 days.
The annual cost can be calculated by multiplying the daily revenue by the number of times the Turbine needs to be maintained in a year (365 days / remaining life).
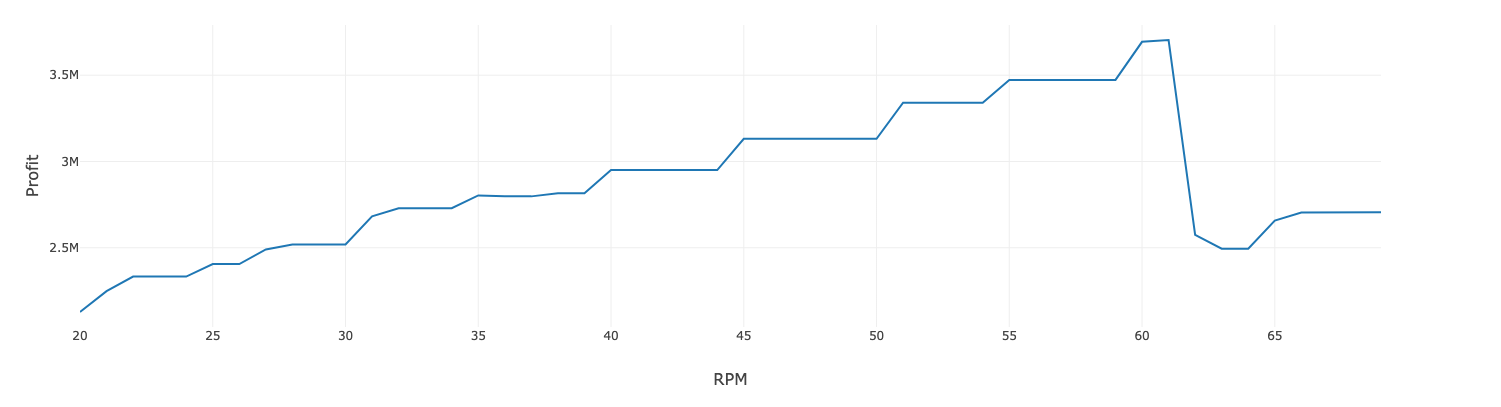
We can iteratively score various operating parameters simply by making multiple calls to our models hosted in Azure ML. By visualizing the expected profit cost for various operating parameters, we can identify the optimal RPM to maximize profit.
Data Serving: Azure Data Explorer and Azure Synapse Analytics
Operational Reporting in ADX
Azure Data Explorer (ADX) provides real-time operational analytics on streaming time-series data. IIoT device data can be streamed directly into ADX from IoT Hub, or pushed from Azure Databricks using the Kusto Spark Connector from Microsoft as shown below.
PowerBI can then be connected to the Kusto table to create a true, real-time, operational dashboard for Turbine engineers.
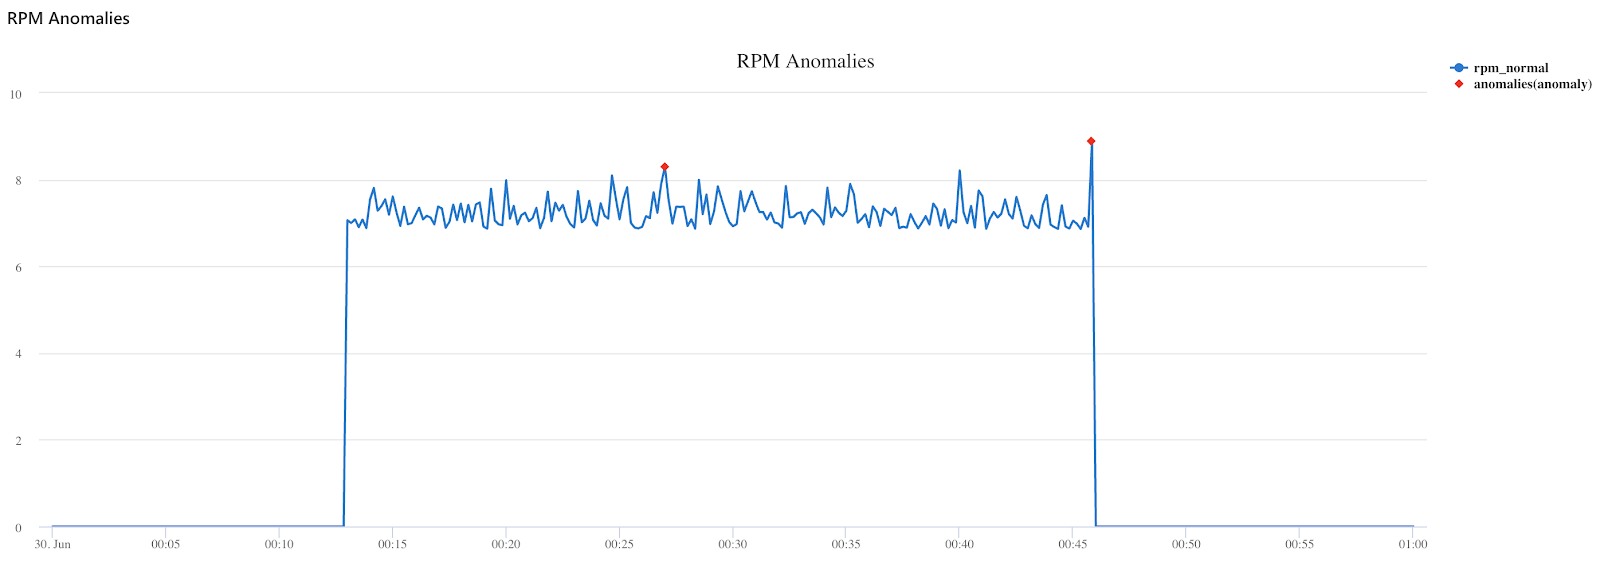
ADX also contains native time-series analysis functions such as forecasting and anomaly detection. For example, the Kusto code below finds anomalous points for RPM readings in the data stream.
Analytical Reporting in ASA
Azure Synapse Analytics (ASA) is the next generation data warehouse from Azure that natively leverages ADLS Gen 2 and integrates with Azure Databricks to enable seamless data sharing between these services.
While leveraging the capabilities of Synapse and Azure Databricks, the recommended approach is to use the best tool for the job given your team’s requirements and the user personas accessing the data. For example, data engineers that need the performance benefits of Delta and data scientists that need a collaborative, rich and flexible workspace will gravitate towards Azure Databricks. Analysts that need a low-code or data warehouse-based SQL environment to ingest, process and visualize data will gravitate towards Synapse.
The Synapse streaming connector for Azure Databricks allows us to stream the Gold Turbine readings directly into a Synapse SQL Pool for reporting.
Alternatively, Azure Data Factory can be used to read data from the Delta format and write it into Synapse SQL Pools. More documentation can be found here.
Now that the data is clean, processed, and available to data analysts for reporting, we can build a live PowerBI dashboard against the live data as well as the predictions from our ML model as shown below.
Summary
To summarize, we have successfully:
- Ingested real-time IIoT data from field devices into Azure
- Performed complex time-series processing on Data Lake directly
- Trained and deployed ML models to optimize the utilization of our Wind Turbine assets
- Served the data to engineers for operational reporting and data analysts for analytical reporting
The key big data technology that ties everything together is Delta Lake. Delta on ADLS provides reliable streaming data pipelines and highly performant data science and analytics queries on massive volumes of time-series data. Lastly, it enables organizations to truly adopt a Lakehouse pattern by bringing best of breed Azure tools to a write-once, access-often data store.
What’s Next?
Try out the notebook hosted here, learn more about Azure Databricks with this 3-part training series and see how to create modern data architectures on Azure by attending this webinar.
Get the latest posts in your inbox
Subscribe to our blog and get the latest posts delivered to your inbox.