Solution Accelerator: Multi-factory Overall Equipment Effectiveness (OEE) and KPI Monitoring
The need to monitor and measure manufacturing equipment performance is critical for operational teams within manufacturing. The advancements in Industry 4.0 and smart manufacturing have enabled manufacturers to collect vast volumes of sensor and equipment data. Making sense of this data for productivity measures provides a critical competitive advantage.
To this end, Overall Equipment Effectiveness (OEE) has become the standard for measuring manufacturing equipment productivity. OEE is determined by the equation:
OEE = Machine Availability x Process Efficiency x Product Quality
According to Engineering USA, an OEE value of 85% and above is considered world-leading. However, many manufacturers achieve a typical range of between 40-60%. Anything below 40% is considered low.
In manufacturing, the OEE metric is used by different teams for a variety of objectives. On the manufacturing shop floor, for instance, OEE is used to identify lagging processes. Business executives on the other hand may use aggregated values to monitor the overall performance of their manufacturing business. In addition, OEE is used as an indicator to evaluate the need to modernize equipment, i.e. to justify CAPEX investments and to monitor the return on invested capital (ROIC). In this instance, OEE is used as the metric for sweating assets.
From an operational standpoint, it is important to work on the freshest information, and critical that information flows continuously to all stakeholders with minimum latency. From the scalability standpoint, it is important that all stakeholders work on the same information and be provided the ability to drill down to identify the behavior of an OEE drift. Both are very difficult to achieve with legacy systems.
The computation of OEE has traditionally been a manual exercise. In this Solution Accelerator, we demonstrate how the computation of OEE may be achieved in a multi-factory environment and in near real-time on Databricks
The Databricks Lakehouse platform
Databricks offers a complete platform to build forecasting solutions (from small scale to large) to help manufacturers maneuver through the challenges of ingesting and converging operational technology (OT) data with traditional data from IT systems, such as ERPs. These include
- A structure to ingest, store and govern different types of data (structured, semi-structured, and unstructured) at scale based on open-source format
- A managed solution to deploy distributed compute to ingest at any velocity, transform, orchestrate and query data without the need to copy data to/from multiple systems.
- Collaborative notebooks (in Python, R, SQL, and Scala) that can be used to explore, enrich, and visualize data from multiple sources while accommodating business knowledge and domain expertise
- Fine-grained modeling and forecasting per item (e.g. product, SKU, or part) that can be parallelized, scaling to thousands, if not hundreds of thousands of items.
- Integrated machine learning features, for example using MLFlow to track experiments ensuring model reproducibility, traceability of performance metrics, and ease of deployment.
As a manufacturer, getting the latest data ensures that decisions are made using the latest information and that this unique source can feed the rest of the data pipeline in real time. As a data engineer, you would need a connector to the IoT source, a means to facilitate the process of sensor data (exactly once ingestion, late arrival management, data quality processing, and pushing the data from raw to aggregated layer with minimal latency).
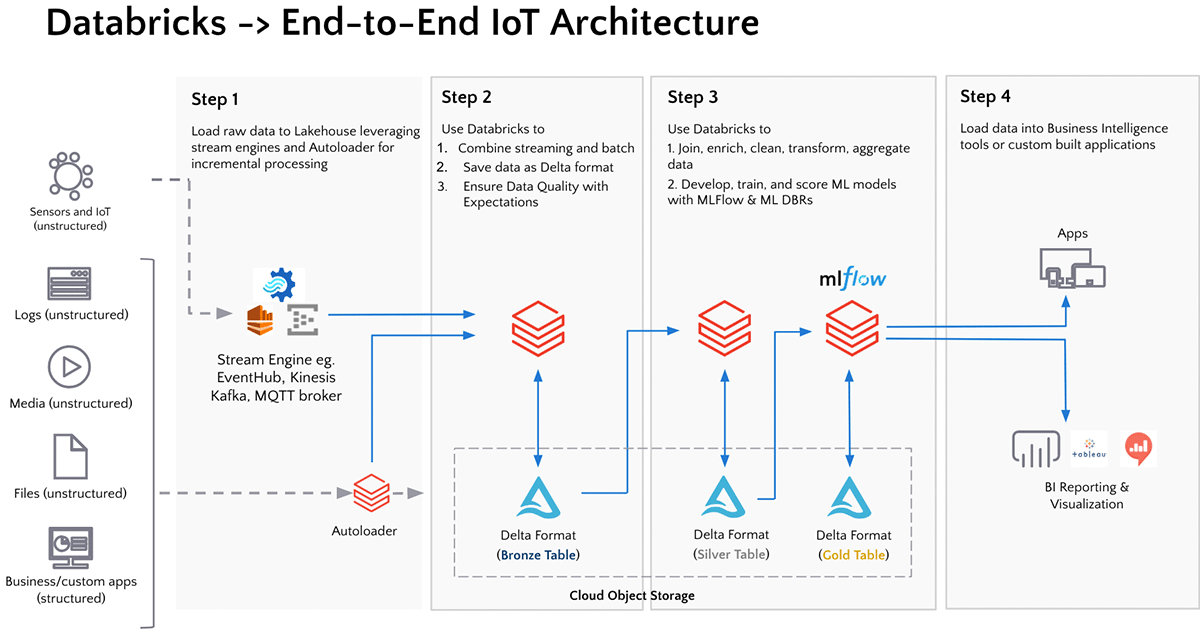
The Databricks Lakehouse provides an end-to-end data engineering, serving, ETL, and machine learning platform that enables organizations to accelerate their analytics workloads by automating the complexity of building and maintaining analytics pipelines through open architecture and formats. This facilitates the connection to high-velocity Industrial IoT data using standard protocols like MQTT, Kafka, Event Hubs, or Kinesis to external datasets, like ERP systems, allowing manufacturers to converge their IT/OT data infrastructure for advanced analytics.
Our Solution Accelerator for OEE and KPI monitoring provides prebuilt notebooks and best practices to enable performant and scalable end-to-end monitoring.
The flow implemented in this solution accelerator is as follows
- Incremental ingestion of data from the sensor / IoT devices
- Clean-up of the data and extraction of the required information
- Integration of workforce dataset coming from our ERP systems
- Merging of both datasets and real-time aggregation based on a temporal window.
- Computation and surfacing of KPIs and metrics to drive valuable insights
Implementation
Data from devices are typically in non-standardized formats such as JSON and binary formats, hence the ability to parse and structure the payloads of data near real-time is important to implement such use cases.
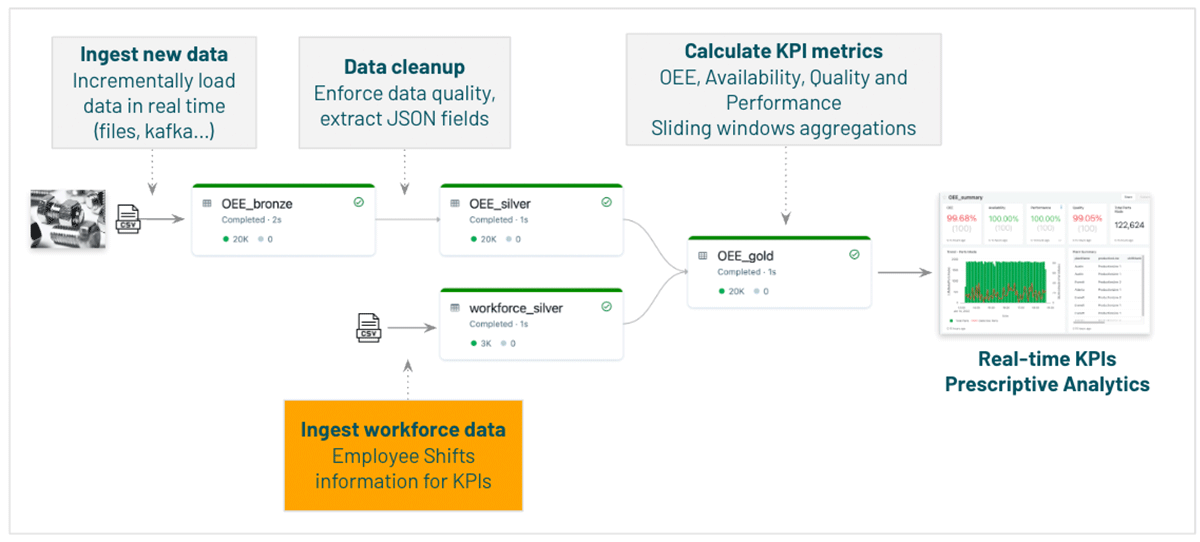
Using a Delta Live Tables pipeline, we leverage the medallion architecture to ingest data from multiple sensors in a semi-structured format (JSON) into our bronze layer where data is replicated in its natural format. The silver layer transformations include parsing of key fields from sensor data that are needed to be extracted/structured for subsequent analysis, and the ingestion of preprocessed workforce data from ERP systems needed to complete the analysis.
Finally, the gold layer aggregates sensor data using structured streaming stateful aggregations, calculates OT metrics e.g. OEE, TA (technical availability), and finally combines the aggregated metrics with workforce data based on shifts allowing for IT-OT convergence.
Surfacing outcomes
The computation of OEE itself is made up of three variables:
- Availability: accounts for planned and unplanned stoppages, percentage of scheduled time that the operation is/was available to operate. This is given by (healthy_time - error_time)/(total_time)
- Performance: a measure of the speed at which the work happens, percentage of its designed speed. This is given by healthy_time/ total_time
- Quality: percentage of good units produced compared to the total units planned/produced. This is given by (Total Parts Made - Defective Parts Made)/Total Parts Made
Recall that OEE = Availability x Performance x Quality.
This computation is relevant because performance improvement on any of these three KPIs will lead to better OEE. In addition, the three indicators above measure the division of actual vs ideal. OEE can be improved by the reduction of:
- Planned downtime
- Failures and breakdowns
- Micro stops
- Speed and throughput loss
- Production rejects
- Rejects on start-up
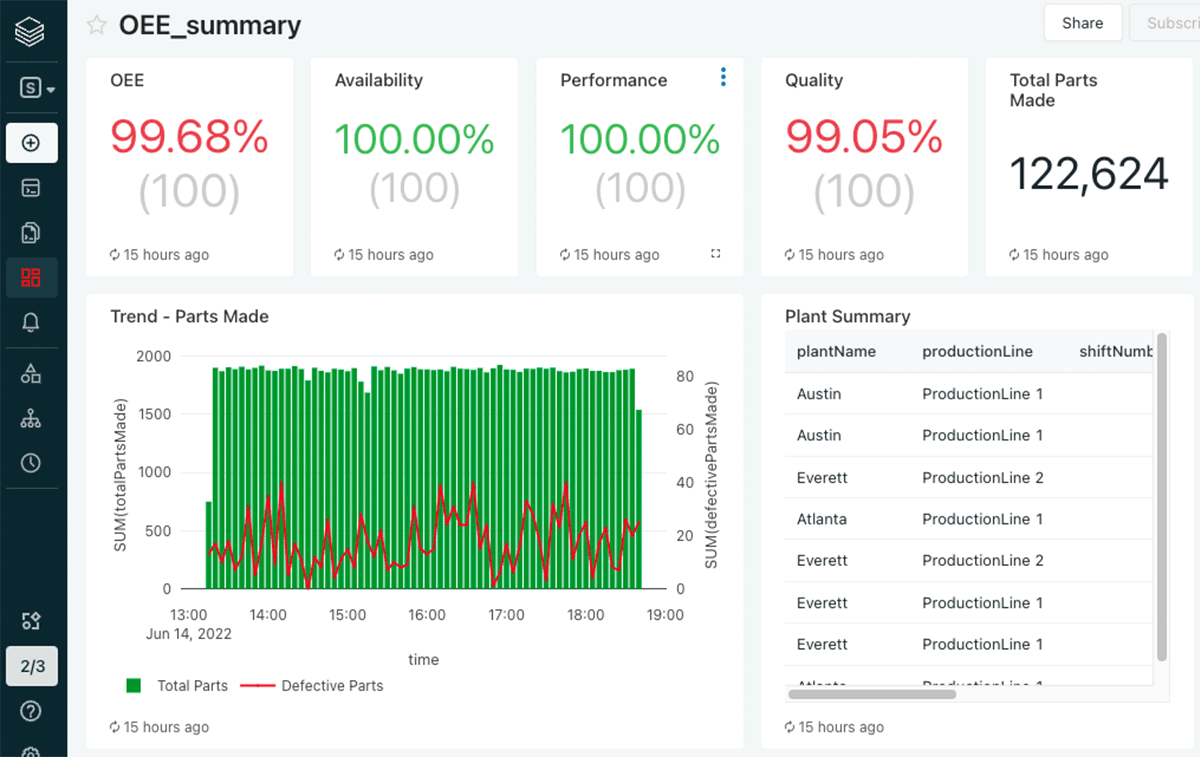
Leveraging the Databricks SQL Workbench, users can leverage last mile queries. An example dashboard is shown in the figure below.
Try our OEE Accelerator
Interested in seeing how this works or implementing it yourself? Check out the Databricks Solution Accelerator for OEE and KPI monitoring in manufacturing. By following the step-by-step instructions provided, users can learn how building blocks provided by Databricks can be assembled to enable performant and scalable end-to-end monitoring.
Get the latest posts in your inbox
Subscribe to our blog and get the latest posts delivered to your inbox.