Apache Spark™ Tutorial: Getting Started with Apache Spark on Databricks
Overview
The Apache Spark DataFrame API provides a rich set of functions (select columns, filter, join, aggregate, and so on) that allow you to solve common data analysis problems efficiently. DataFrames also allow you to intermix operations seamlessly with custom Python, R, Scala, and SQL code. In this tutorial module, you will learn how to:
- Load sample data
- View a DataFrame
- Run SQL queries
- Visualize the DataFrame
We also provide a sample notebook that you can import to access and run all of the code examples included in the module.
Load sample data
The easiest way to start working with DataFrames is to use an example Databricks dataset available in the /databricks-datasetsfolder accessible within the Databricks workspace. To access the file that compares city population versus median sale prices of homes, load the file /databricks-datasets/samples/population-vs-price/data_geo.csv.
View the DataFrame
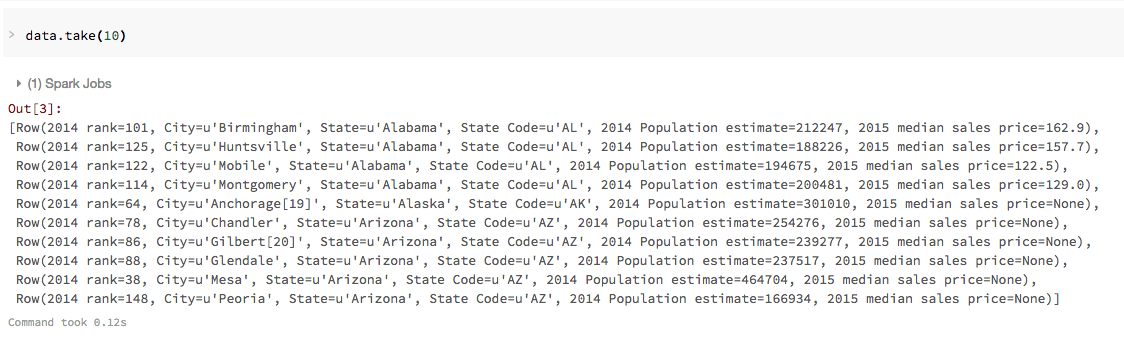
Now that you have created the data DataFrame, you can quickly access the data using standard Spark commands such as take(). For example, you can use the command data.take(10) to view the first ten rows of the data DataFrame. Because this is a SQL notebook, the next few commands use the %python magic command.
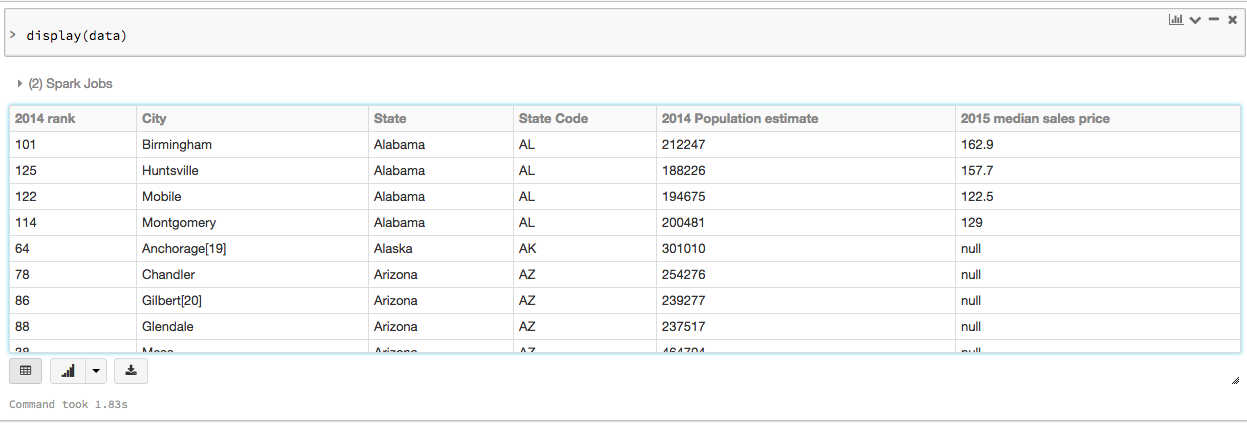
To view this data in a tabular format, you can use the Databricks display() command instead of exporting the data to a third-party tool.
Run SQL queries
Before you can issue SQL queries, you must save your data DataFrame as a temporary table:
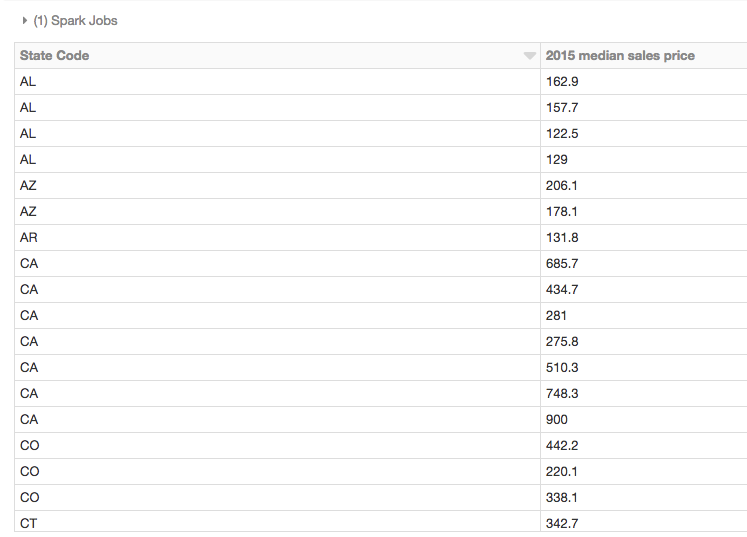
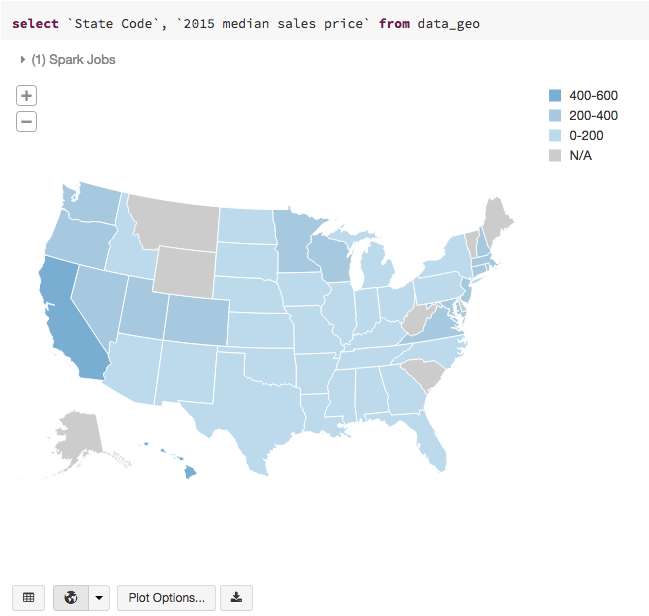
Then, in a new cell, specify a SQL query to list the 2015 median sales price by state:
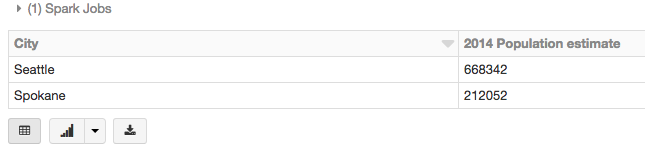
Or, query for population estimate in the state of Washington:
Visualize the DataFrame
An additional benefit of using the Databricks display() command is that you can quickly view this data with a number of embedded visualizations. Click the down arrow next to the
![]()
to display a list of visualization types:
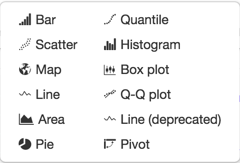
Then, select the Map icon to create a map visualization of the sale price SQL query from the previous section
We also provide a sample notebook that you can import to access and run all of the code examples included in the module.