Apache Spark™ Tutorial: Getting Started with Apache Spark on Databricks
Overview
The Apache Spark Dataset API provides a type-safe, object-oriented programming interface. DataFrame is an alias for an untyped Dataset [Row]. Datasets provide compile-time type safety—which means that production applications can be checked for errors before they are run—and they allow direct operations over user-defined classes. The Dataset API also offers high-level domain-specific language operations like sum(), avg(), join(), select(), groupBy(), making the code a lot easier to express, read, and write.
In this tutorial module, you will learn how to:
- Create sample data
- Load sample data
- View a DataSet
- Process and visualize the Dataset
We also provide a sample notebook that you can import to access and run all of the code examples included in the module.
Create sample data
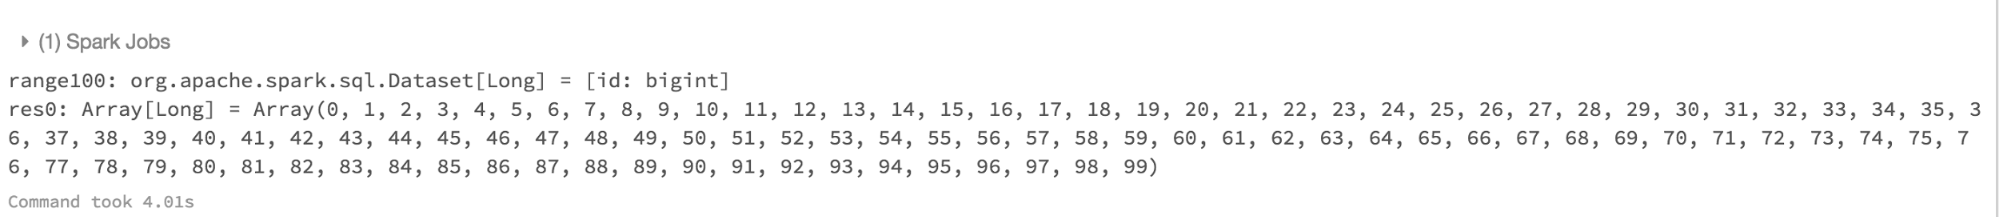
There two ways to create Datasets: dynamically and by reading from a JSON file using SparkSession. First, for primitive types in examples or demos, you can create Datasets within a Scala or Python notebook or in your sample Spark application. For example, here’s a way to create a Dataset of 100 integers in a notebook. We use the spark variable to create 100 integers as Dataset[Long].
Load sample data
The more common way is to read a data file from an external data source, such HDFS, blob storage, NoSQL, RDBMS, or local filesystem. Spark supports multiple formats: JSON, CSV, Text, Parquet, ORC, and so on. To read a JSON file, you also use the SparkSession variable spark.
The easiest way to start working with Datasets is to use an example Databricks dataset available in the /databricks-datasets folder accessible within the Databricks workspace.
At the time of reading the JSON file, Spark does not know the structure of your data. That is, it doesn’t know how you want to organize your data into a typed-specific JVM object. It attempts to infer the schema from the JSON file and creates a DataFrame = Dataset[Row] of generic Row objects.
You can explicitly convert your DataFrame into a Dataset reflecting a Scala class object by defining a domain-specific Scala case classand converting the DataFrame into that type:
You can do something similar with IoT device state information captured in a JSON file: define a case class, read the JSON file, and convert the DataFrame = Dataset[DeviceIoTData].
There are two reasons to convert a DataFrame into a type-specific JVM object. First, after an explicit conversion, for all relational and query expressions using Dataset API, you get compile-type safety. For example, if you use a filter operation using the wrong data type, Spark detects mismatch types and issues a compile error rather an execution runtime error, so that you catch errors earlier. Second, the Dataset API provides high-order methods, which makes code much easier to read and develop. In the section Process and visualize the Dataset, notice how using Dataset typed objects makes the code easier to express and read.
As in the Person example, here create a case class that encapsulates the Scala object. To access the file that contains IoT data, load the file /databricks-datasets/iot/iot_devices.json.
View the Dataset
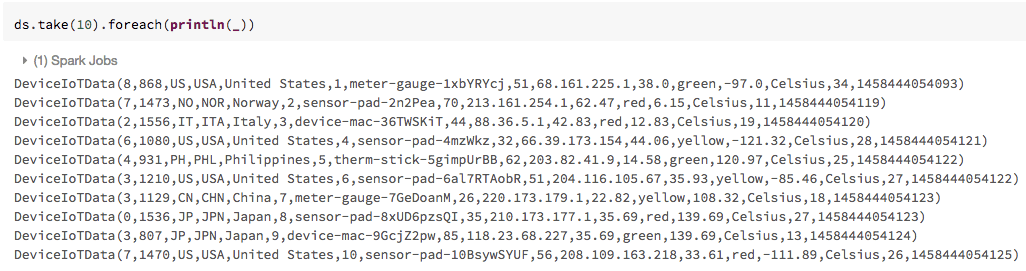
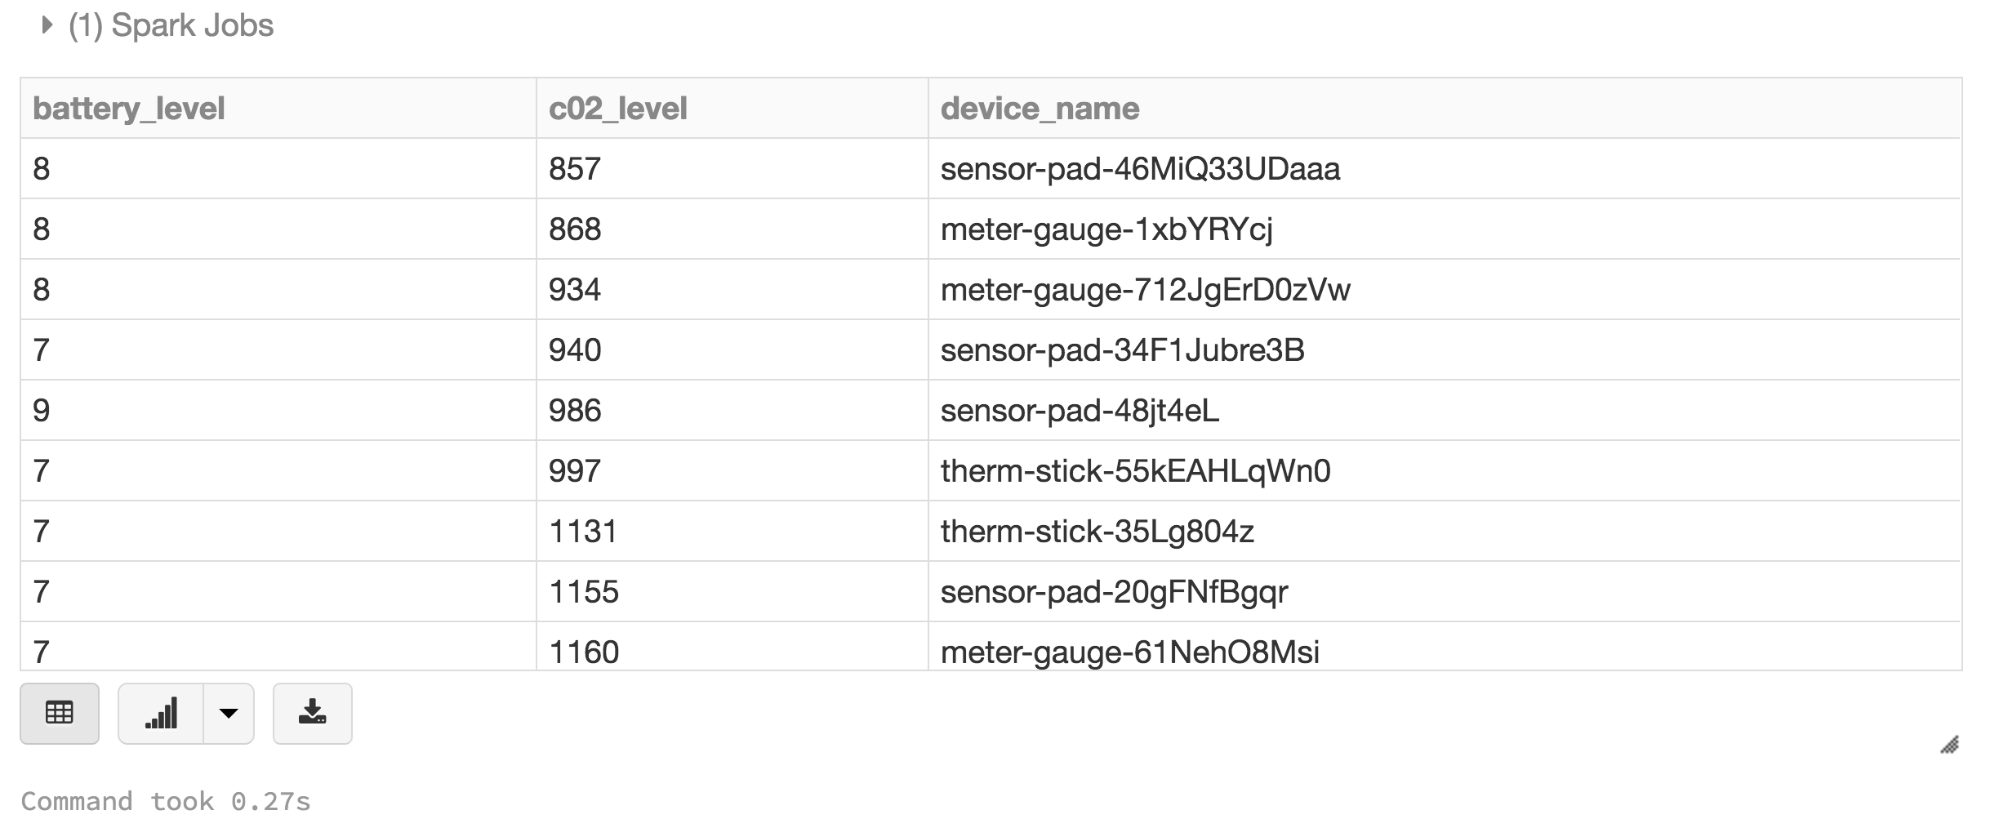
To view the data in a tabular format instead of exporting it to a third-party tool, you can use the Databricks display() command. Once you have loaded the JSON data and converted it into a Dataset for your type-specific collection of JVM objects, you can view them as you would view a DataFrame, by using either display() or standard Spark commands, such as take(), foreach(), and println() API calls.
Process and visualize the Dataset
A Dataset has transformations and actions. Most important are the high-level domain specific operations such as sum(), select(), avg(), join(), and union(). For more information, see the Scala Dataset API.
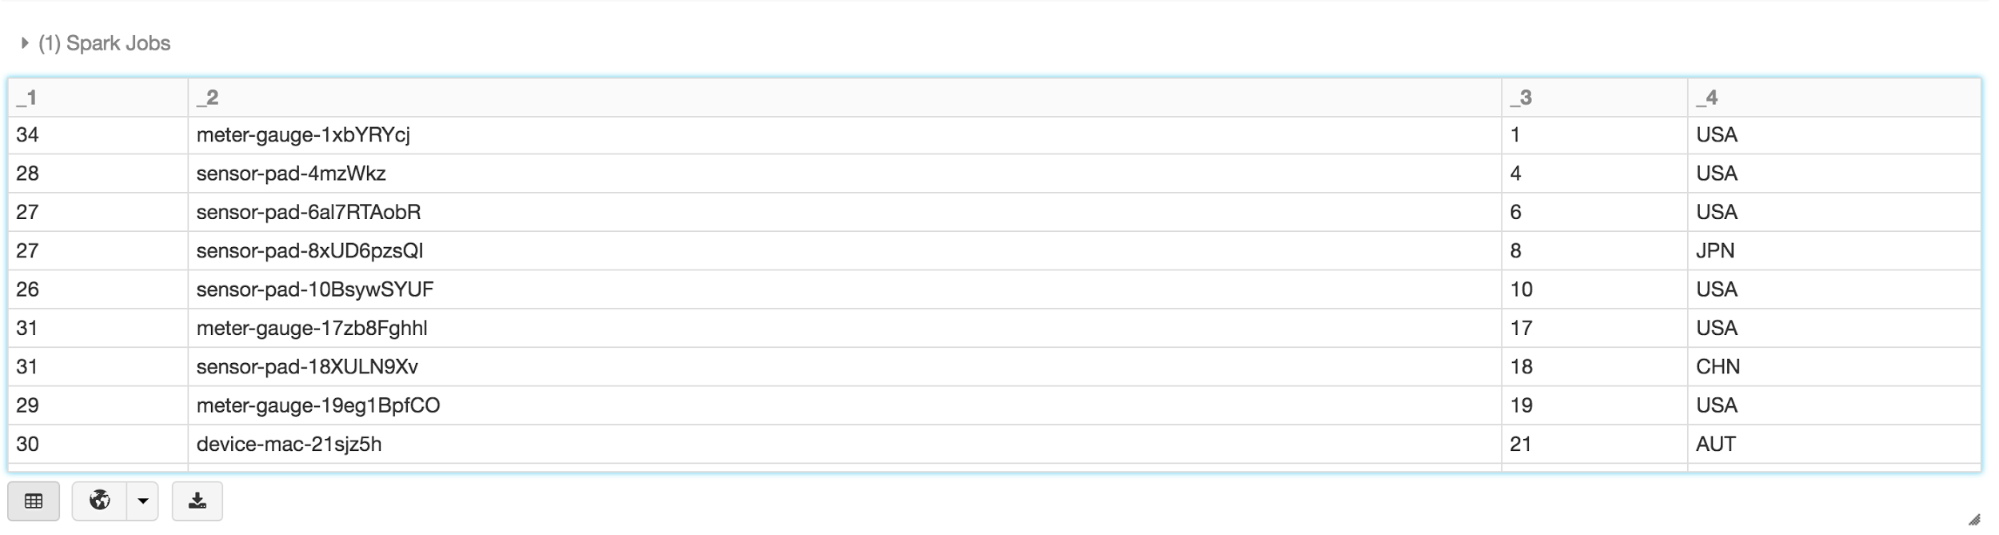
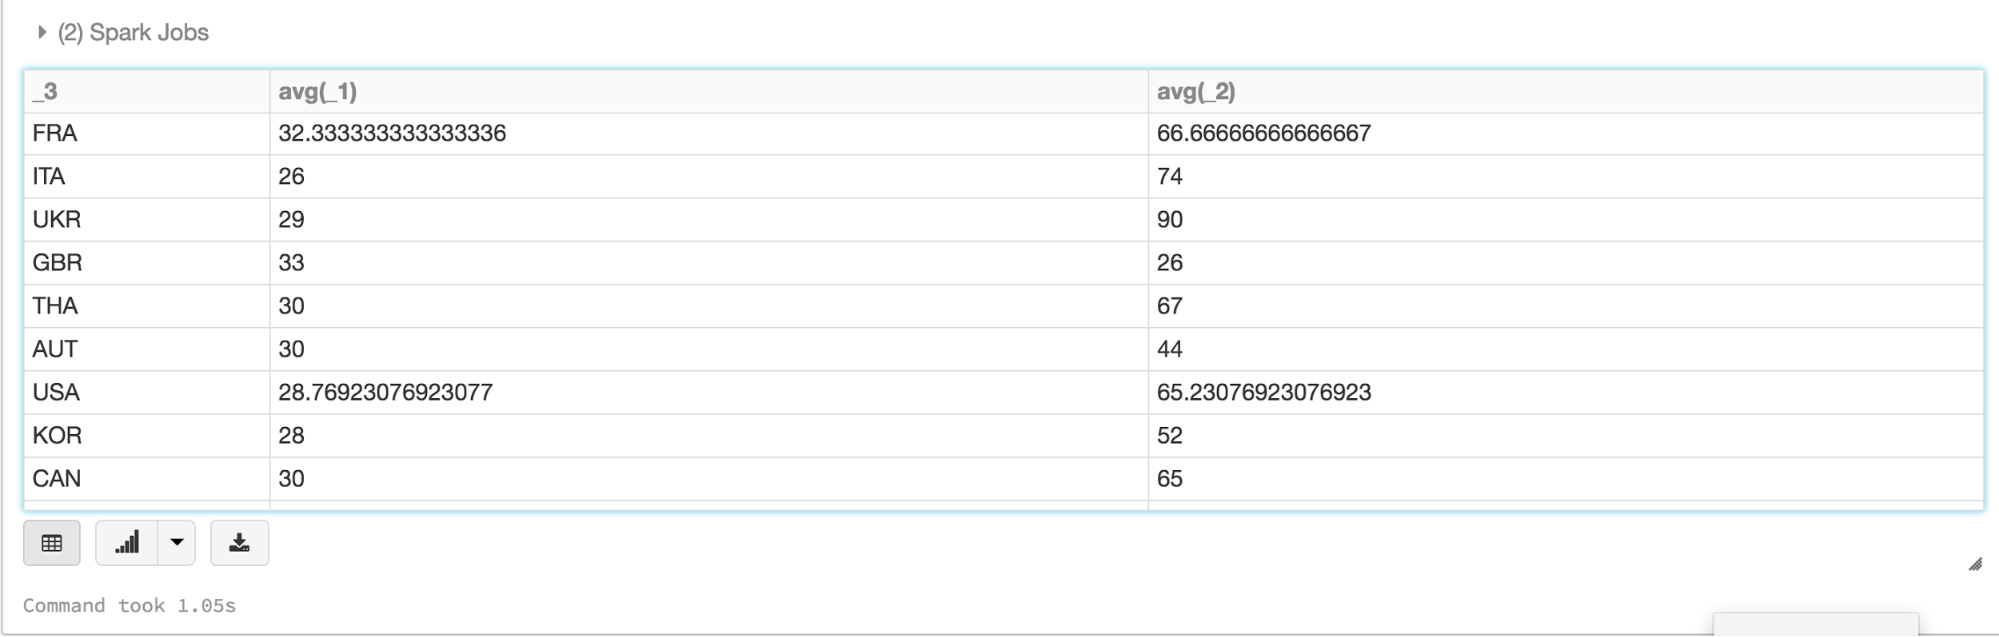
In this example, you can use filter(), map(), groupBy(), and avg(), all higher-level methods, to create new Datasets. What’s noteworthy is that you can access the attributes by their names as defined in the case class. That is, use the dot notation to access individual fields. As such, it makes code easy to read and write.
 Here is an animated gif showing how quickly you can go from table to map to charts using Datasets and Databricks display() command.
  An additional benefit of using the Databricks
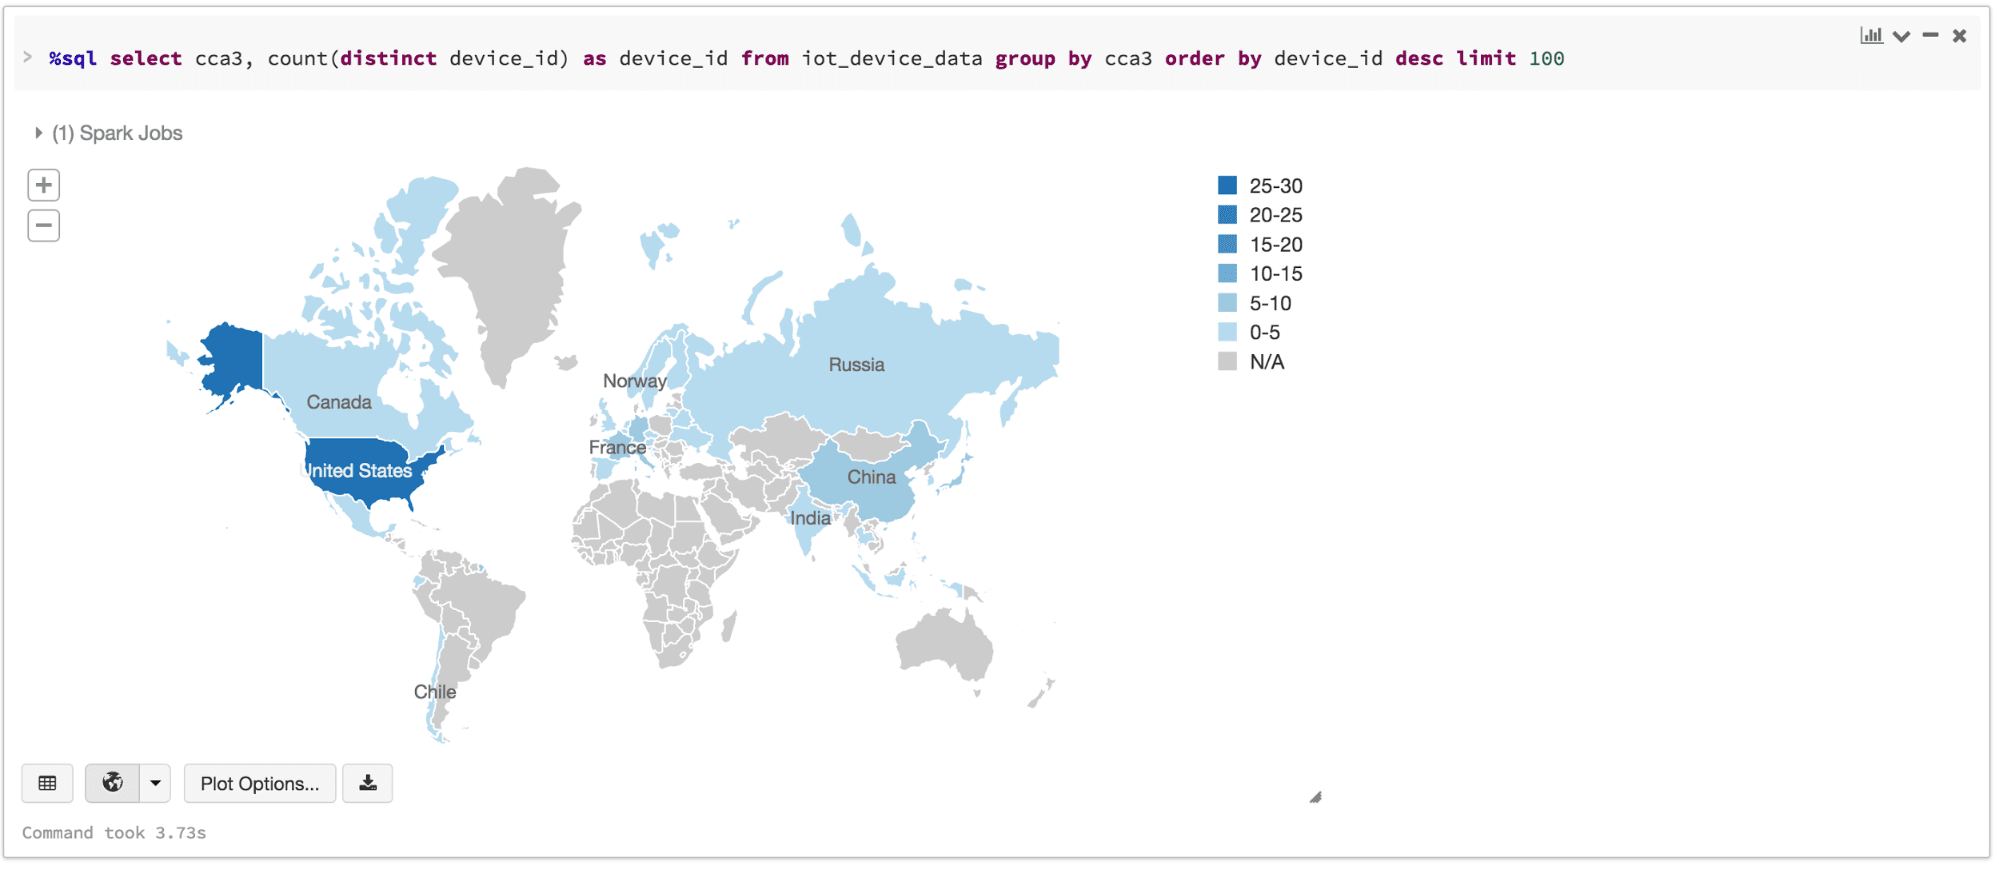
 display() command is that you can quickly view this data with a number of embedded visualizations. For example, in a new cell, you can issue SQL queries and click the map to see the data. But first you must save your dataset, ds, as a temporary table.
Having saved the Dataset of DeviceIoTData as a temporary table, you can issue SQL queries to it.
We also provide a sample notebook that you can import to access and run all of the code examples included in the module.