Whether in retail, finance, cyber security, or any other industry, spotting anomalous behavior as soon as it happens is an absolute priority. The lack of capabilities to do so could mean lost revenue, fines from regulators, and violation of customer privacy and trust due to security breaches in the case of cyber security. Thus, finding that handful of rather unusual credit card transactions, spotting that one user acting suspiciously or identifying strange patterns in request volume to a web service, could be the difference between a great day at work and a complete disaster.
The Challenge in Detecting Anomalies
Anomaly detection poses several challenges. The first is the data science question of what an 'anomaly' looks like. Fortunately, machine learning has powerful tools to learn how to distinguish usual from anomalous patterns from data. In the case of anomaly detection, it is impossible to know what all anomalies look like, so it's impossible to label a data set for training a machine learning model, even if resources for doing so are available. Thus, unsupervised learning has to be used to detect anomalies, where patterns are learned from unlabelled data.
Even with the perfect unsupervised machine learning model for anomaly detection figured out, in many ways, the real problems have only begun. What is the best way to put this model into production such that each observation is ingested, transformed and finally scored with the model, as soon as the data arrives from the source system? That too, in a near real-time manner or at short intervals, e.g. every 5-10 minutes? This involves building a sophisticated extract, load, and transform (ELT) pipeline and integrating it with an unsupervised machine learning model that can correctly identify anomalous records. Also, this end-to-end pipeline has to be production-grade, always running while ensuring data quality from ingestion to model inference, and the underlying infrastructure has to be maintained.
Solving the Challenge with the Databricks Lakehouse Platform
With Databricks, this process is not complicated. One could build a near-real-time anomaly detection pipeline entirely in SQL, with Python solely being used to train the machine learning model. The data ingestion, transformations, and model inference could all be done with SQL.
Specifically, this blog outlines training an isolation forest algorithm, which is particularly suited to detecting anomalous records, and integrating the trained model into a streaming data pipeline created using Delta Live Tables (DLT). DLT is an ETL framework that automates the data engineering process. DLT uses a simple declarative approach for creating reliable data pipelines and fully manages the underlying infrastructure at scale for batch and streaming data. The result is a near-real-time anomaly detection system. Specifically, the data used in this blog is a sample of synthetic data generated with the goal of simulating credit card transactions from Kaggle, and the anomalies thus detected are fraudulent transactions.
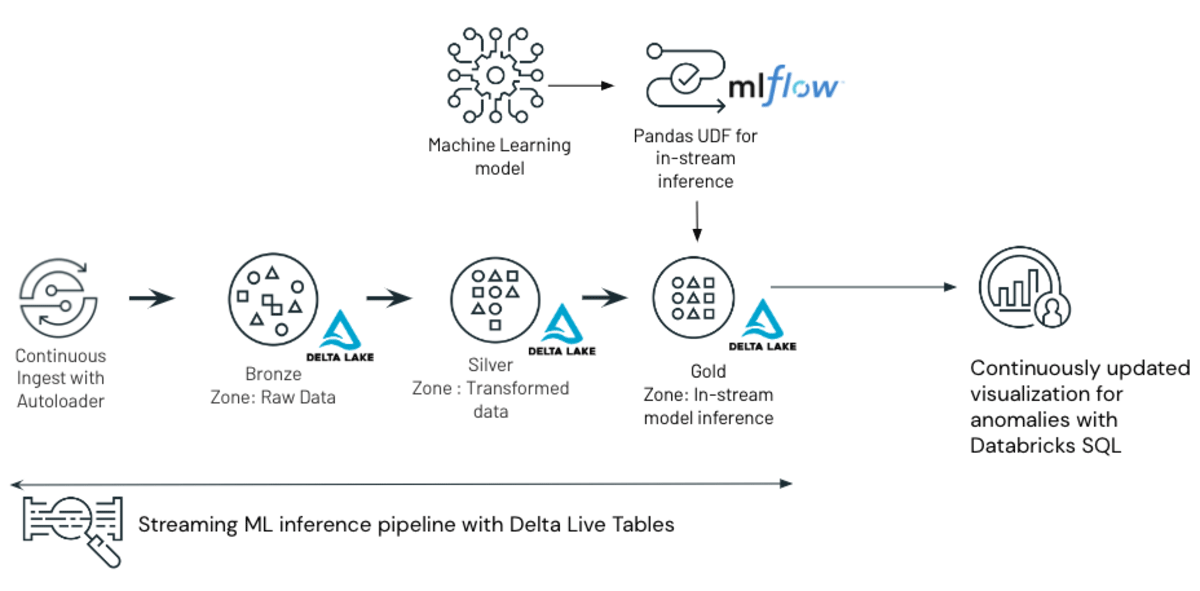
Architecture of the ML and Delta Live Tables based anomaly detection solution outlined in the blog
The scikit-learn isolation forest algorithm implementation is available by default in the Databricks Machine Learning runtime and will use the MLflow framework to track and log the anomaly detection model as it is trained. The ETL pipeline will be developed entirely in SQL using Delta Live Tables.
Isolation Forests For Anomaly Detection on Unlabelled Data
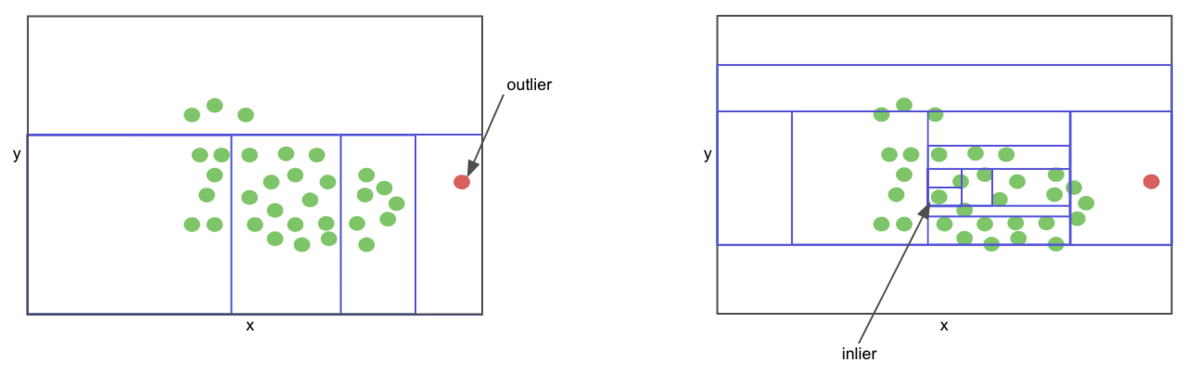
Isolation forests are a type of tree-based ensemble algorithms similar to random forests. The algorithm is designed to assume that inliers in a given set of observations are harder to isolate than outliers (anomalous observations). At a high level, a non-anomalous point, that is a regular credit card transaction, would live deeper in a decision tree as they are harder to isolate, and the inverse is true for an anomalous point. This algorithm can be trained on a label-less set of observations and subsequently used to predict anomalous records in previously unseen data.
Isolating an outlier is easier than isolating an inlier
How can Databricks Help in model training and tracking?
When doing anything machine learning related on Databricks, using clusters with the Machine Learning (ML) runtime is a must. Many open source libraries commonly used for data science and machine learning related tasks are available by default in the ML runtime. Scikit-learn is among those libraries, and it comes with an excellent implementation of the isolation forest algorithm.
How the model is defined can be seen below.
from sklearn.ensemble import IsolationForest
isolation_forest = IsolationForest(n_jobs=-1, warm_start=True, random_state=42)
This runtime, among other things, enables tight integration of the notebook environment with MLflow for machine learning experiment tracking, model staging, and deployment.
Any model training or hyperparameter optimization done in the notebook environment tied to a ML cluster is automatically logged with MLflow autologging, a functionality enabled by default.
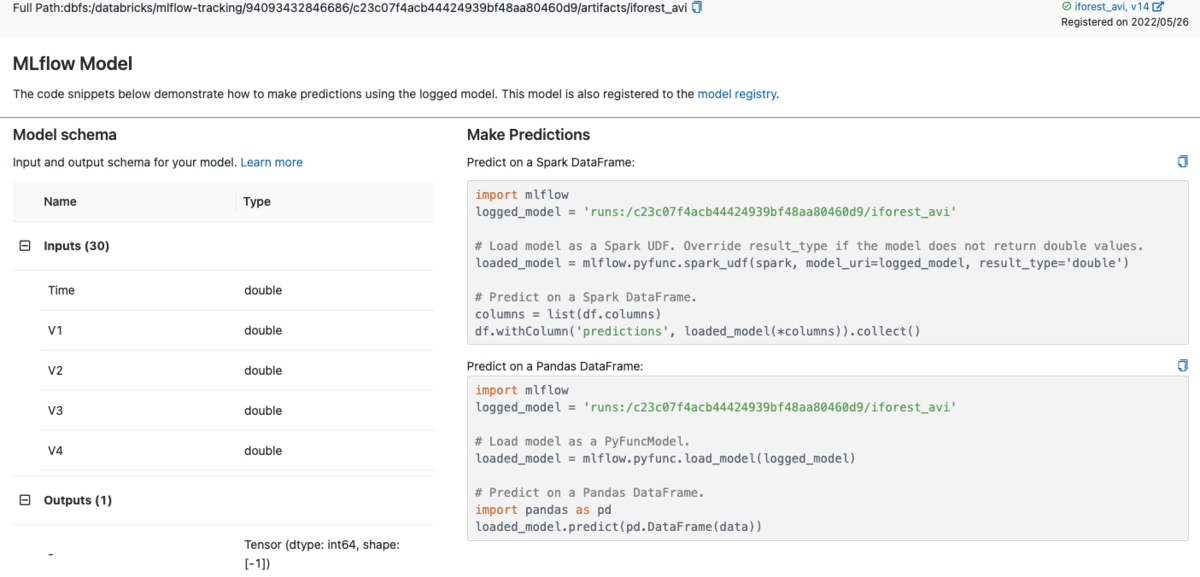
Once the model is logged, it is possible to register and deploy the model within MLflow in a number of ways. In particular, to deploy this model as a vectorized User Defined Function (UDF) for distributed in-stream or batch inference with Apache Spark™, MLflow generates the code for creating and registering the UDF within the user interface (UI) itself, as can be seen in the image below.
MLflow generates code for creating and registering the Apache Spark UDF for model inference
In addition to this, the MLflow REST API allows the existing model in production to be archived and the newly trained model to be put into production with a few lines of code that can be neatly packed into a function as follows.
deftrain_model(mlFlowClient, loaded_model, model_name, run_name)->str:"""
Trains, logs, registers and promotes the model to production. Returns the URI of the model in prod
"""with mlflow.start_run(run_name=run_name) as run:
# 0. Fit the model loaded_model.fit(X_train)
# 1. Get predictions y_train_predict = loaded_model.predict(X_train)
# 2. Create model signature signature = infer_signature(X_train, y_train_predict)
runID = run.info.run_id
# 3. Log the model alongside the model signature mlflow.sklearn.log_model(loaded_model, model_name, signature=signature, registered_model_name= model_name)
# 4. Get the latest version of the model model_version = mlFlowClient.get_latest_versions(model_name,stages=['None'])[0].version
# 5. Transition the latest version of the model to production and archive the existing versions client.transition_model_version_stage(name= model_name, version = model_version, stage='Production', archive_existing_versions= True)
return mlFlowClient.get_latest_versions(model_name, stages=["Production"])[0].source
In a production scenario, you would want a single record only to be scored by the model once. In Databricks, you can use the Auto Loader to guarantee this "exactly once" behavior. Auto Loader works with Delta Live Tables, Structured Streaming applications, either using Python or SQL.
Another important factor to consider is that the nature of anomalous occurrences, whether environmental or behavioral, changes with time. Hence, the model needs to be retrained on new data as it arrives.
The notebook with the model training logic can be productionized as a scheduled job in Databricks Workflows, which effectively retrains and puts into production the newest model each time the job is executed.
Achieving near real-time anomaly detection with Delta Live Tables
The machine learning aspect of this only presents a fraction of the challenge. Arguably, what's more challenging is building a production-grade near real-time data pipeline that combines data ingestion, transformations and model inference. This process could be complex, time-consuming, and error-prone.
Building and maintaining the infrastructure to do this in an always-on capacity and error handling involves more software engineering know-how than data engineering. Also, data quality has to be ensured through the entire pipeline. Depending on the specific application, there could be added dimensions of complexity.
This is where Delta Live Tables (DLT) comes into the picture.
In DLT parlance, a notebook library is essentially a notebook that contains some or all of the code for the DLT pipeline. DLT pipelines may have more than one notebook's associated with them, and each notebook may use either SQL or Python syntax. The first notebook library will contain the logic implemented in Python to fetch the model from the MLflow Model Registry and register the UDF so that the model inference function can be used once ingested records are featurized downstream in the pipeline. A helpful tip: in DLT Python notebooks, new packages must be installed with the %pip magic command in the first cell.
The second DLT library notebook can be composed of either Python or SQL syntax. To prove the versatility of DLT, we used SQL to perform the data ingestion, transformation and model inference. This notebook contains the actual data transformation logic which constitutes the pipeline.
The ingestion is done with Auto Loader, which can load data streamed into object storage incrementally. This is read into the bronze (raw data) table in the medallion architecture. Also, in the syntax given below, please note that the streaming live table is where data is continuously ingested from object storage. Auto Loader is configured to detect schema as the data is ingested. Auto Loader can also handle evolving schema, which will apply to many real-world anomaly detection scenarios.
CREATEOR REFRESH STREAMING LIVE TABLE transaction_readings_raw
COMMENT "The raw transaction readings, ingested from landing directory"
TBLPROPERTIES ("quality" = "bronze")
ASSELECT*FROM cloud_files("/FileStore/tables/transaction_landing_dir", "json", map("cloudFiles.inferColumnTypes", "true"))
DLT also allows you to define data quality constraints and provides the developer or analyst the ability to remediate any errors. If a given record does not meet a given constraint, DLT can retain the record, drop it or halt the pipeline entirely. In the example below, constraints are defined in one of the transformation steps that drop records if the transaction time or amount is not given.
CREATEOR REFRESH STREAMING LIVE TABLE transaction_readings_cleaned(
CONSTRAINT valid_transaction_reading EXPECT (AMOUNT ISNOTNULLANDTIMEISNOTNULL) ON VIOLATION DROPROW)
TBLPROPERTIES ("quality" = "silver")
COMMENT "Drop all rows with nulls for Time and store these records in a silver delta table"
ASSELECT*FROM STREAM(live.transaction_readings_raw)
Delta Live Tables also supports User Defined Functions (UDFs). UDFs may be used for to enable model inference in a streaming DLT pipeline using SQL. In the below example, we areusing the previously registered Apache Spark™ Vectorized UDF that encapsulates the trained isolation forest model.
CREATEOR REFRESH STREAMING LIVE TABLE predictions
COMMENT "Use the isolation forest vectorized udf registered in the previous step to predict anomalous transaction readings"
TBLPROPERTIES ("quality" = "gold")
ASSELECT cust_id, detect_anomaly(<enter by="" column="" commas="" names="" separated="">) asanomalous from STREAM(live.transaction_readings_cleaned)
This is exciting for SQL analysts and Data Engineers who prefer SQL as they can use a machine learning model trained by a data scientist in Python e.g. using scikit-learn, xgboost or any other machine learning library, for inference in an entirely SQL data pipeline!
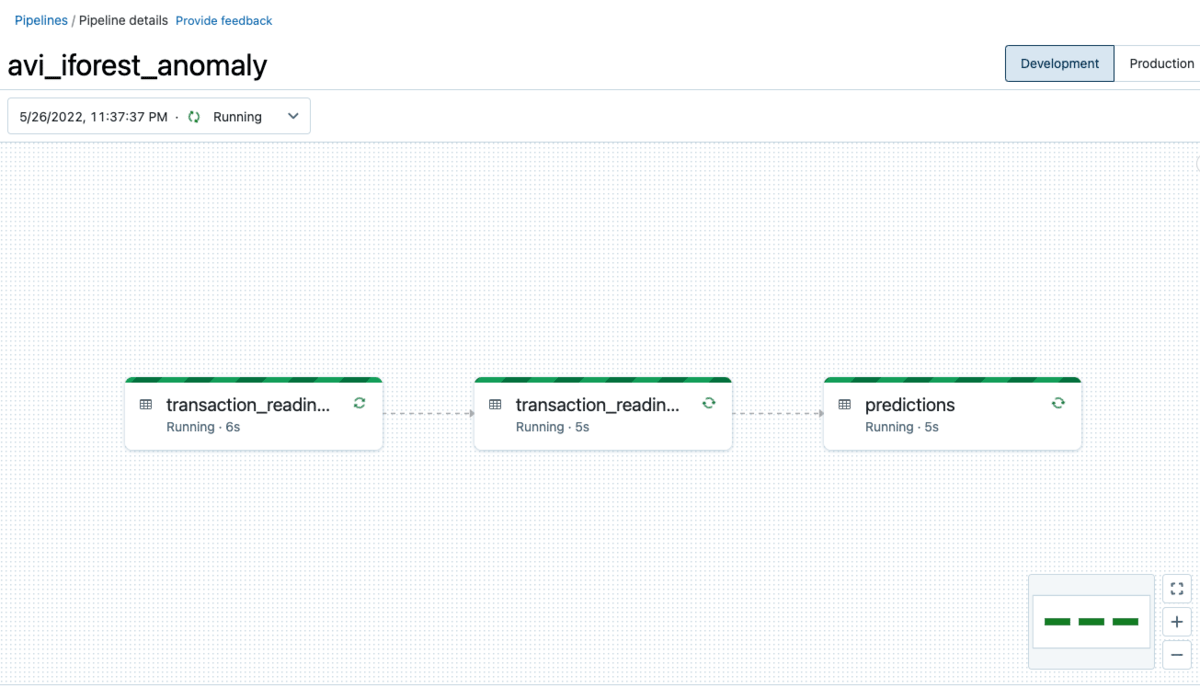
These notebooks are used to create a DLT pipeline (detailed in the Configuration Details section below ). After a brief period of setting up resources, tables and figuring out dependencies (and all the other complex operations DLT abstracts away from the end user), a DLT pipeline will be rendered in the UI, through which data is continuously processed and anomalous records are detected in near real time with a trained machine learning model.
End to End Delta Live Tables pipeline as seen in the DLT User Interface
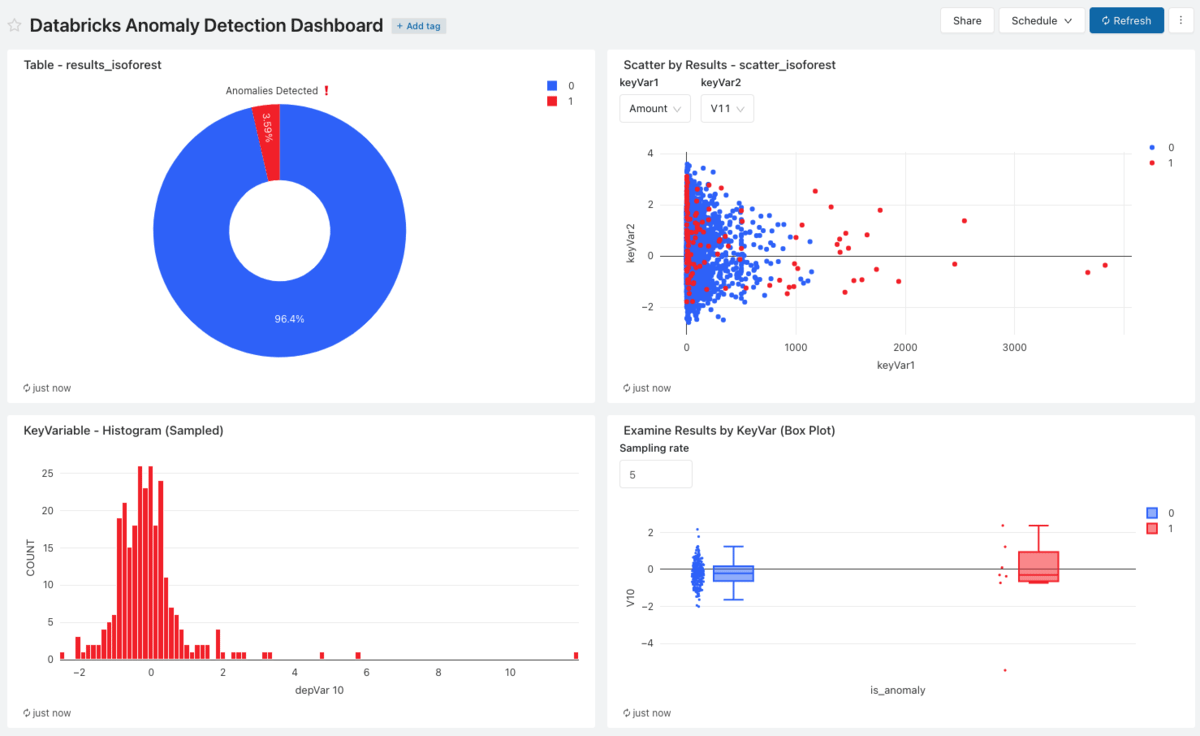
While this pipeline is executing, Databricks SQL can be used to visualize the anomalous records thus identified, with continuous updates enabled by the Databricks SQL Dashboard refresh functionality. Such a dashboard built with visualized based on queries executed against the 'Predictions' table can be seen below.
Databricks SQL Dashboard built to interactively display predicted anomalous records
In summary, this blog details the capabilities available in the Databricks Machine Learning and Workflows used to train an isolation forest algorithm for anomaly detection and the process of defining a Delta Live Table pipeline which is capable of performing this feat in a near real-time manner. Delta Live Tables abstracts the complexity of the process from the end user and automates it.
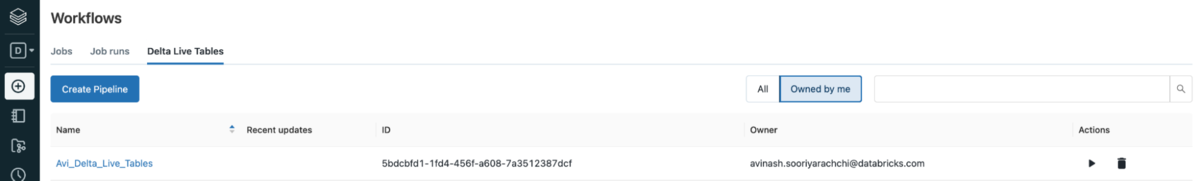
A Delta Live Tables pipeline can be created using the Databricks Workflows user interface
To perform anomaly detection in a near real time manner, a DLT pipeline has to be executed in Continuous Mode. The process described in the official quickstart (https://docs.databricks.com/data-engineering/delta-live-tables/delta-live-tables-quickstart.html ) can be followed to create, with the previously described Python and SQL notebooks which are available in the repository for this blog. Other configurations can be filled in as desired.
In use cases where intermittent pipeline runs are acceptable, for example, anomaly detection on records collected by a source system in batch, the pipeline can be executed in Triggered mode, with intervals as low as 10 minutes. Then a schedule can be specified for this triggered pipeline to run and in each execution, the data will be processed through the pipeline in an incremental manner.
Subsequently, the pipeline configuration with cluster autoscaling enabled (to handle varying load of records being passed through the pipeline without processing bottlenecks) can be saved and the pipeline started. Alternatively, all these configurations can be neatly described in JSON format and entered in the same input form.
Delta Live Tables figures out cluster configurations, underlying table optimizations and a number of other important details for the end user. For running the pipeline, Development mode can be selected, which is conducive for iterative development or Production mode, which is geared towards production. In the latter, DLT automatically performs retries and cluster restarts.
It is important to emphasize that all that is described above can be done via the Delta Live Tables REST API. This is particularly useful for production scenarios where the DLT pipeline executing in continuous mode can be edited on the fly with no downtime, for example each time the isolation forest is retrained via a scheduled job as mentioned earlier in this blog.
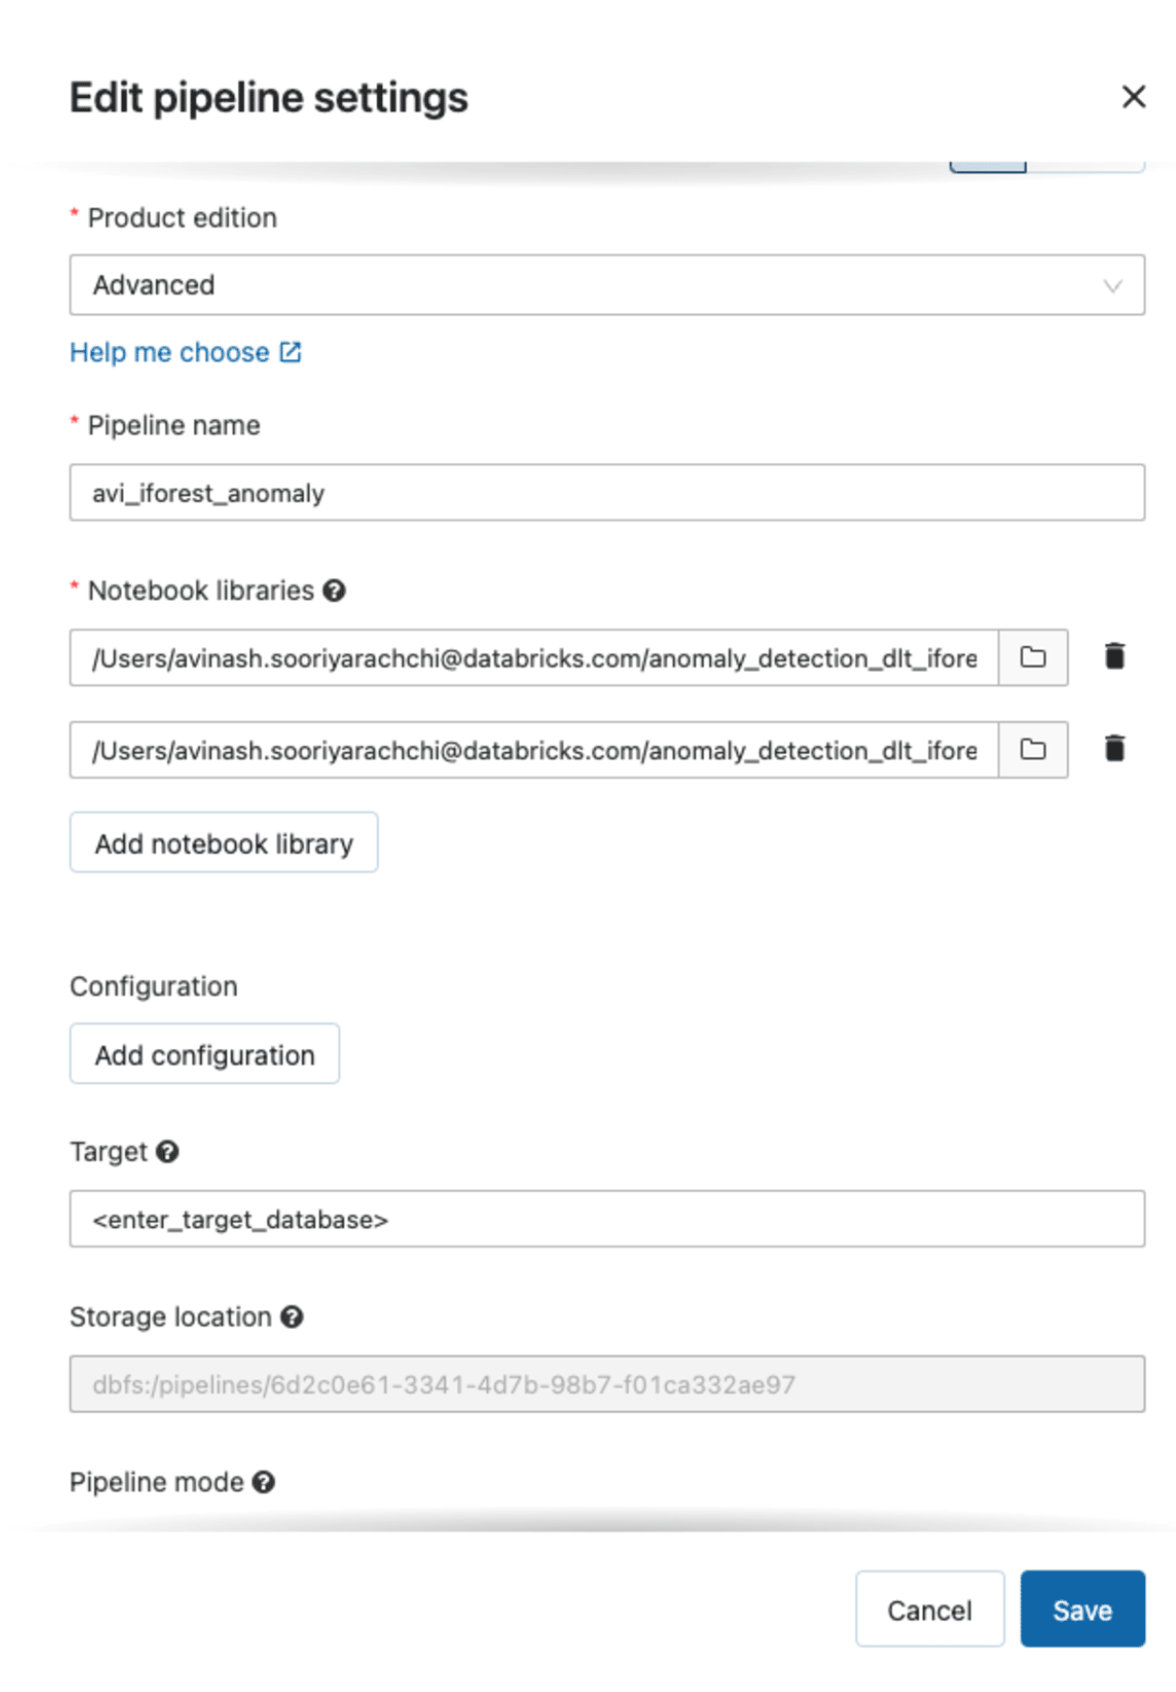
Configurations for the Delta Live Tables pipelines in this example. Enter a target database name to store the Delta tables created
Please make sure to use clusters with the Databricks Machine Learning runtime for model training tasks. Although the example given here is rather simplistic, the same principles hold for more complicated transformations and Delta Live Tables was built to reduce the complexity inherent in building such pipelines. We welcome you to adapt the ideas in this blog for your use case.
This is a collaborative post from Databricks and Anomalo. We thank Amy Reams, VP Business Development, Anomalo, for her contributions. An organization's data...